- Search Forex Factory
- 29 Results (3 Threads , 26 Replies )
- Rafei replied Jul 6, 2019
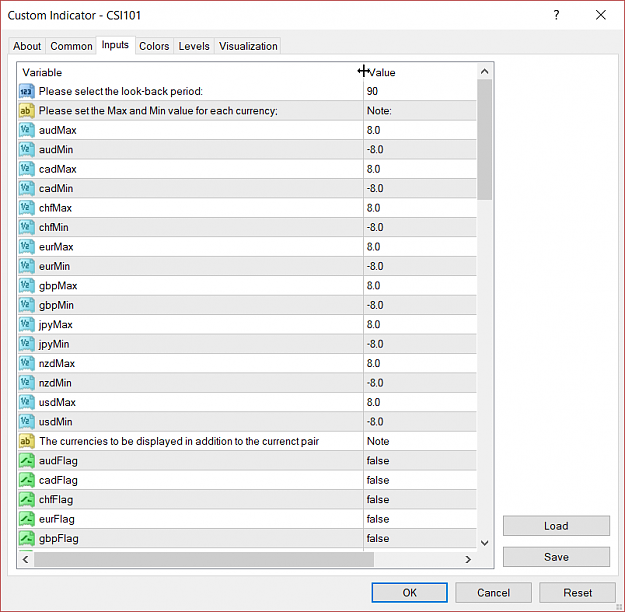
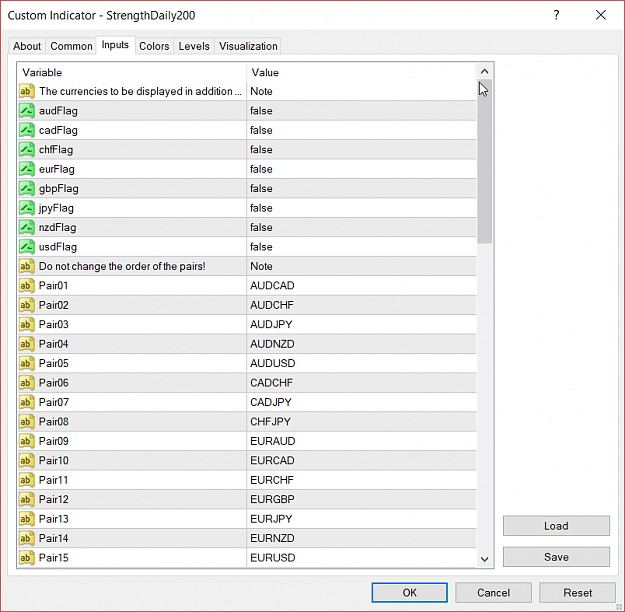
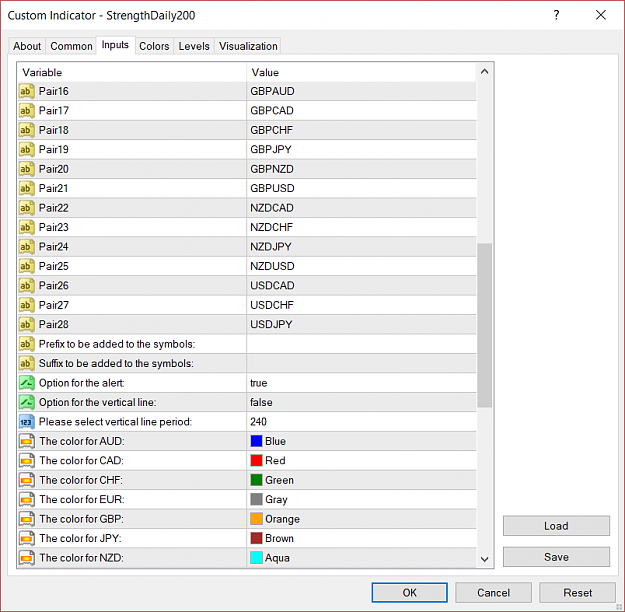
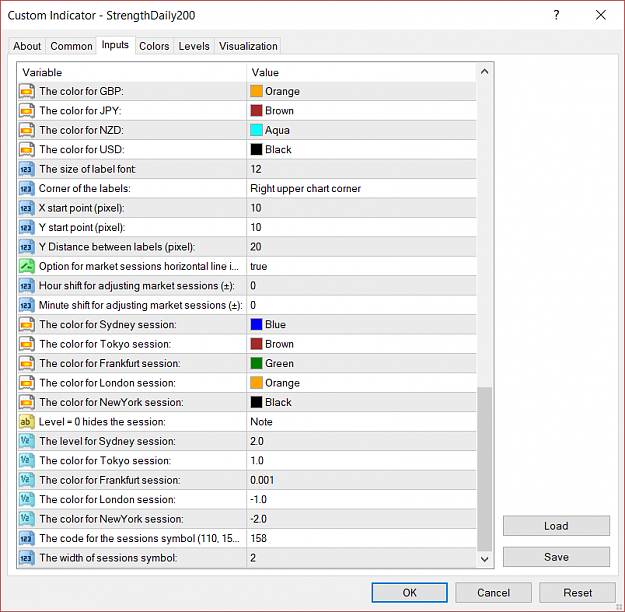
Gauer, Hi. Would you please share your thoughts about CSI indicator performance and the choice of Min / Max values? By the way, here is a view of the options of the indicator: image Thanks.
An indicator for the strength of a currency
- Rafei replied Jul 6, 2019
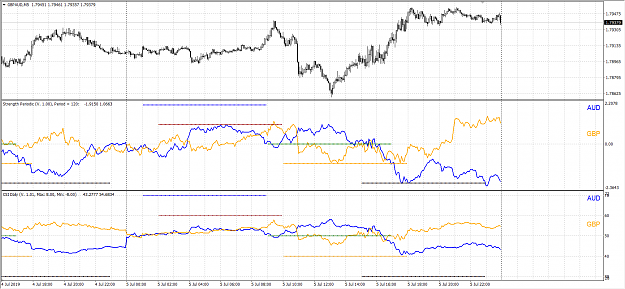
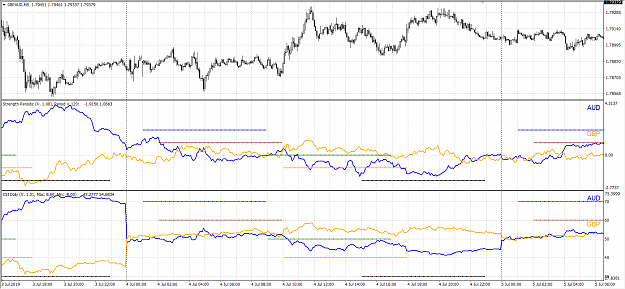
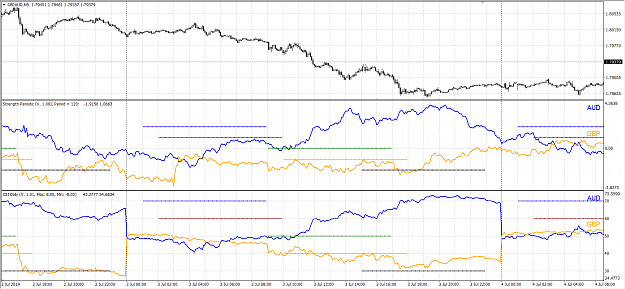
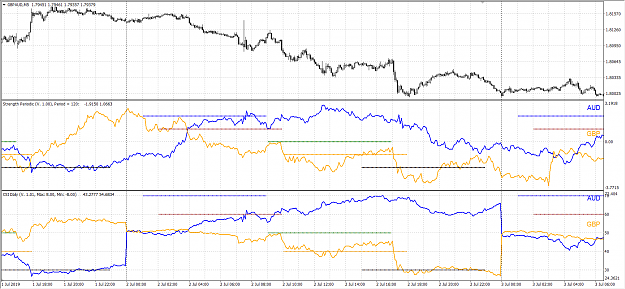
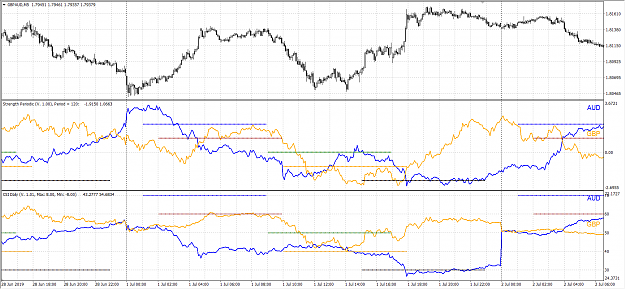
Very significant operation of the CSI indicator we can see, the indicator truly indicates the strength of currencies against each other. The examples below proof this claim: image image image image image In all 5 previous days, the CSI ...
An indicator for the strength of a currency
- Rafei replied Jul 5, 2019
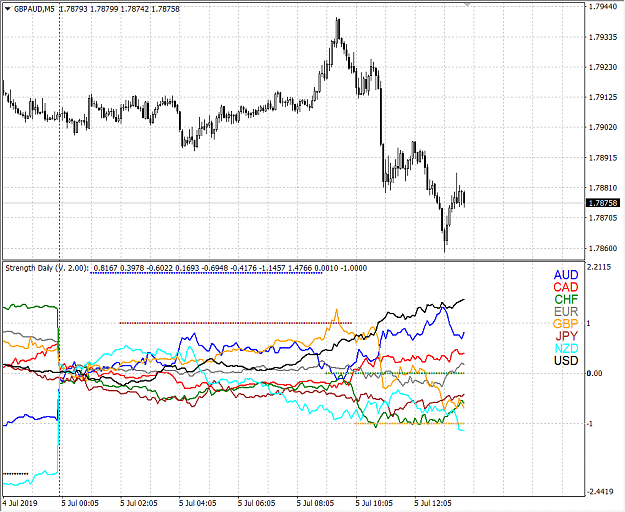
OK guys, I have created the new version of the Daily Currency Strength indicator. The new feature are: Session indicator is added. The symbol, level, width, and color of the session signals can be changed. Setting the level to 0 will hide the ...
An indicator for the strength of a currency
- Rafei replied Jul 4, 2019
Hi energyliger, I found the mentioned author, ziheng zhuang, and the page for the currency strength (he calls it Currency Relative Strength): Currency Relative Strength Thanks for your comments, I think that here are more experienced traders who can ...
An indicator for the strength of a currency
- Rafei replied Jul 3, 2019
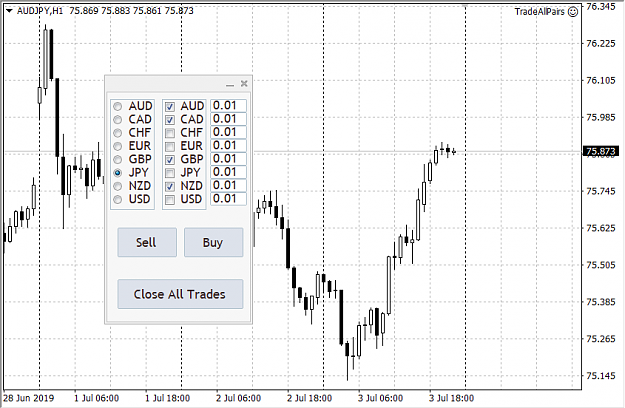
Hi dear Kosomolate, Remarkable view from your application of trading currency baskets. This is what I was first looking for, trading a currency. I also created an EA for trading multiple pairs as fast as possible, here is a view of my multiple pairs ...
An indicator for the strength of a currency
- Rafei replied Jun 27, 2019
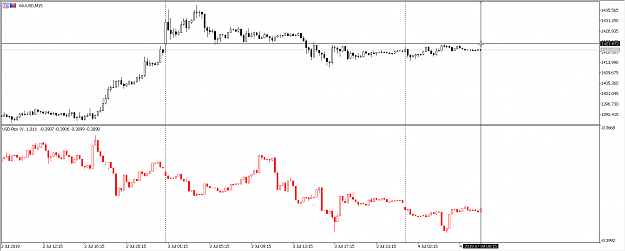
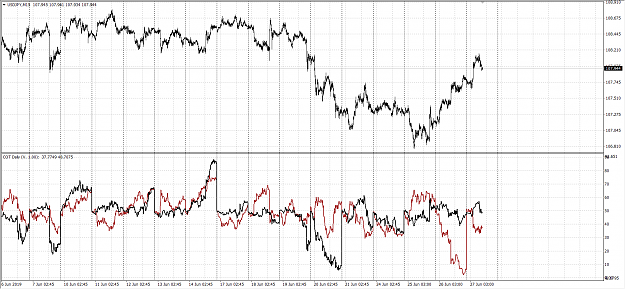
I was very busy in the last two days. But, I have created the indicator for COT of strength. Please find it at the first post. The figure bellow, is a picture of the USDJPY chart and the COT indicator in 15 min time-frame: image Please give your ...
An indicator for the strength of a currency
- Rafei replied Jun 25, 2019
A view on the current day: image What do you think?
An indicator for the strength of a currency
- Rafei replied Jun 24, 2019
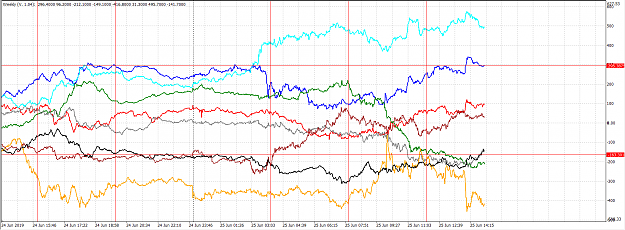
Today, we saw an interesting price action from currencies: image
An indicator for the strength of a currency
- Rafei replied Jun 24, 2019
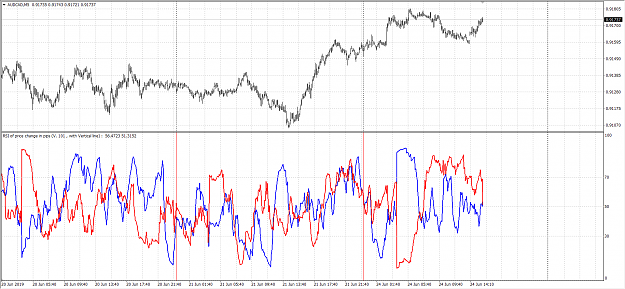
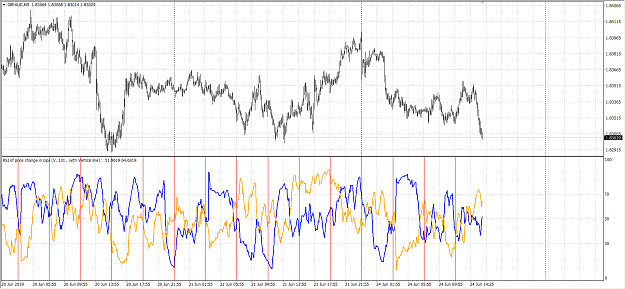
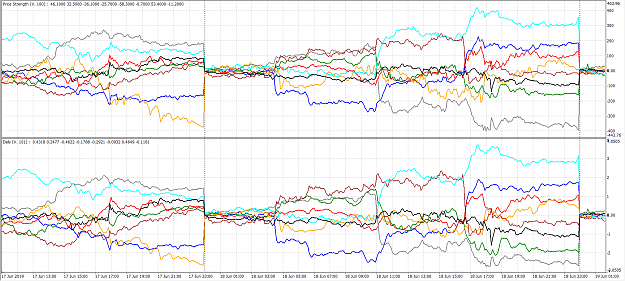
RSI of the signals are calculated and the corresponding indicator is added to the first page. These are some figures of the RSI of the currency changes and the price chart: AUDCAD: image GBPAUD: image
An indicator for the strength of a currency
- Rafei replied Jun 23, 2019
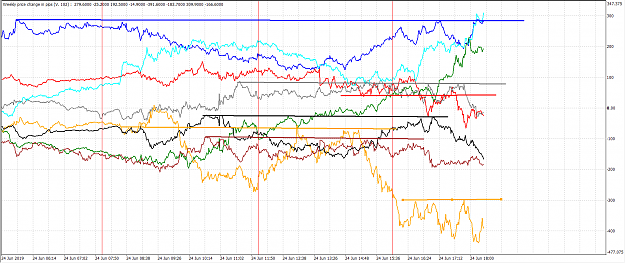
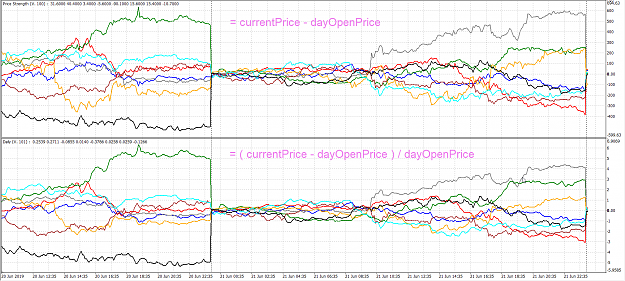
Thanks to your comments, I have designed another test for clarifying obscure things. For this purpose, I have created a similar indicator in which the price change is calculated according to the open price of the day and the result is exactly the ...
An indicator for the strength of a currency
- Rafei replied Jun 23, 2019
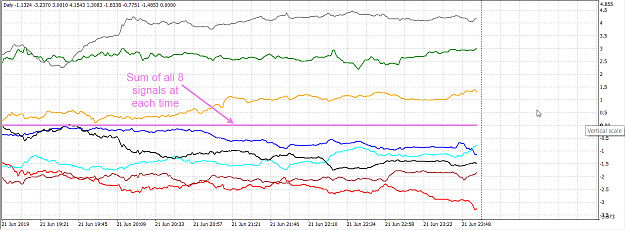
Thanks for your opinions. I have done a test and calculate the sum of the all 8 signals for each bar. This sum is zero at all times. Does this mean anything to you? image
An indicator for the strength of a currency
- Rafei replied Jun 23, 2019
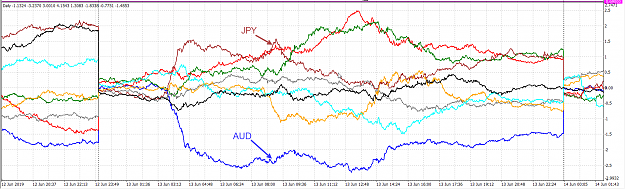
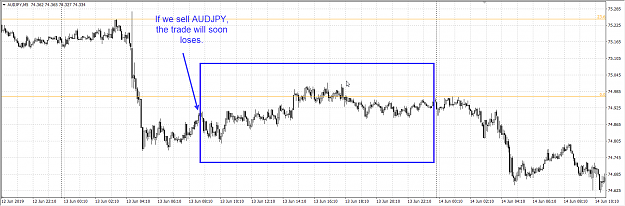
Here we can see that at 9 AM, JPY is strongest and AUD is the weakest. If we sell AUDJPY, the trade will soon loses. image Here is the chart of the AUDJPY at that time: image It is not important which one is the strongest and which one is the ...
An indicator for the strength of a currency
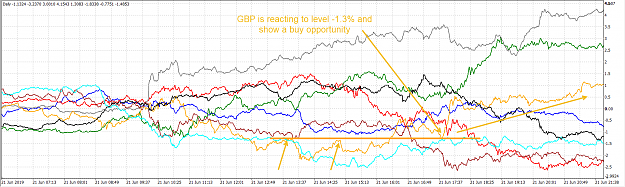
- Rafei replied Jun 23, 2019
At the last friday, GBP had a buy opportunity: image Entry level: -1.3 % Stop level: -1.8 % Target Level: -0.8 % or more Sell -> EURGBP Buy -> GBPAUD Buy -> GBPCAD Buy -> GBPCHF Buy -> GBPJPY Buy -> GBPNZD Buy -> GBPUSD (trading all GBP pairs, ...
An indicator for the strength of a currency
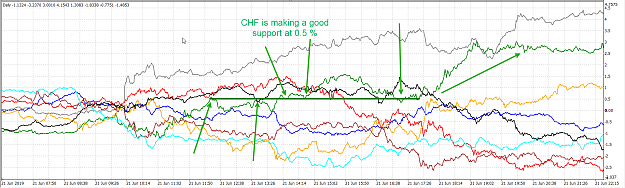
- Rafei replied Jun 23, 2019
Hi Fred. Very good. It is good to notice that each signal in the indicator shows the strength or weakness of an individual currency (not a pair). By analyzing the past data (back-test), I didn't find any safe level which can be considered as buy or ...
An indicator for the strength of a currency
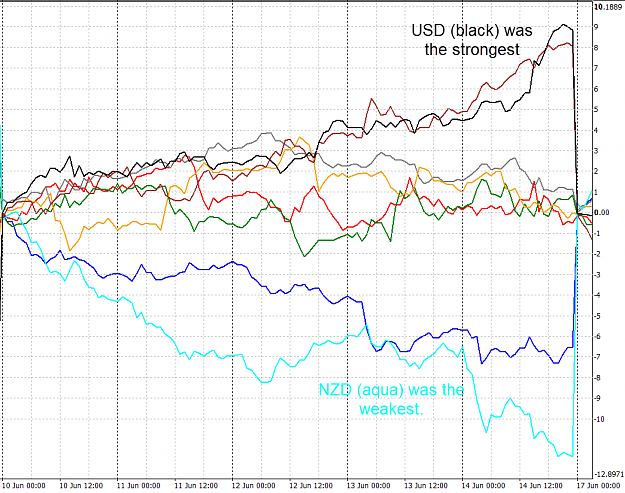
- Rafei replied Jun 21, 2019
A weak ago, USD was the strongest and gave 900 pips ! image
An indicator for the strength of a currency
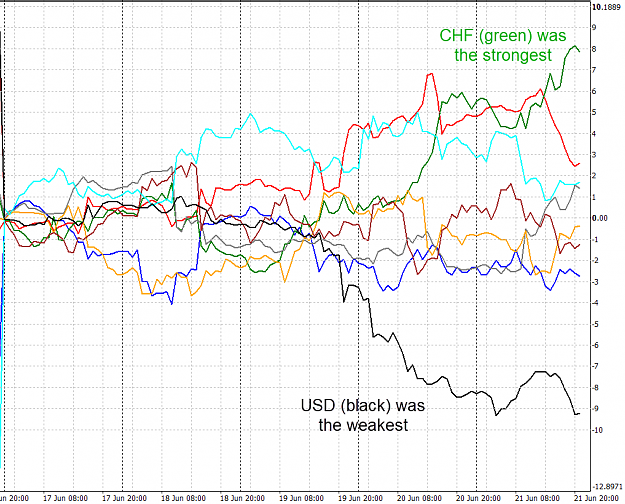
- Rafei replied Jun 21, 2019
A overall view on the weak: image USD was the weakest, CHF was the strongest. If someone had sold USD at the beginning of this weak, he/she would earned 900 pips at the end of the weak (now), which 210 pips belong to USDCHF !
An indicator for the strength of a currency
- Rafei replied Jun 21, 2019
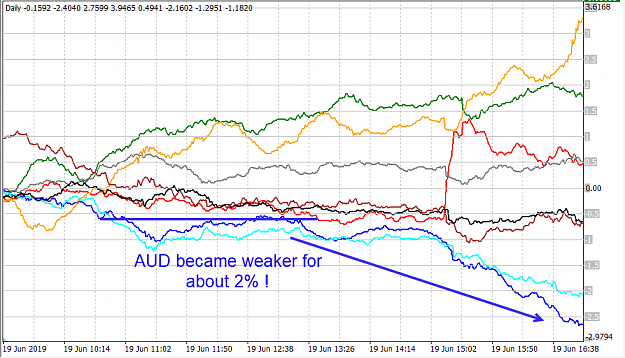
The AUD became weaker for about 2 % . If some one sell the AUD (sell all of its pairs), then 2% weakness equals to about 200 pips ! image It is interesting to say that, even if NZD became weaker, still selling AUD (all pairs) gives 200 pips ! This ...
An indicator for the strength of a currency
- Rafei replied Jun 19, 2019
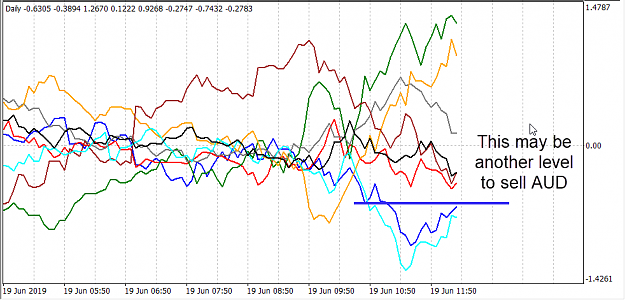
Now, from indicator, AUD comes back to the last low level and this may be a level for selling AUD again! image
An indicator for the strength of a currency
- Rafei replied Jun 19, 2019
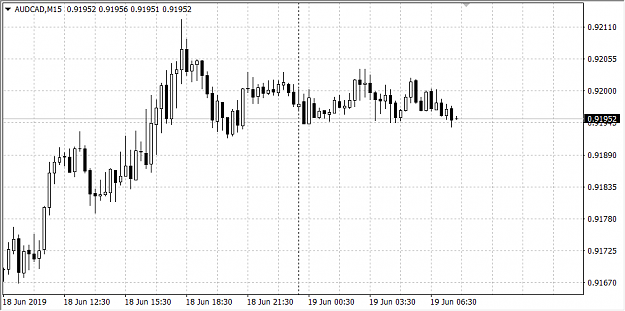
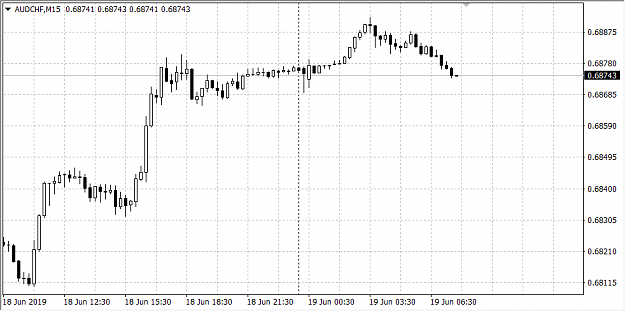
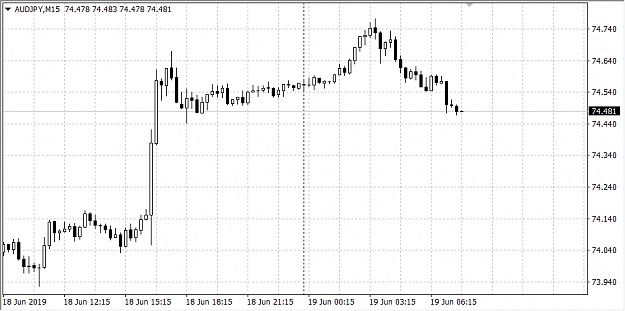
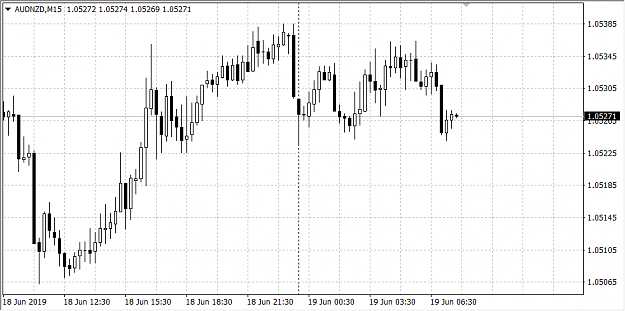
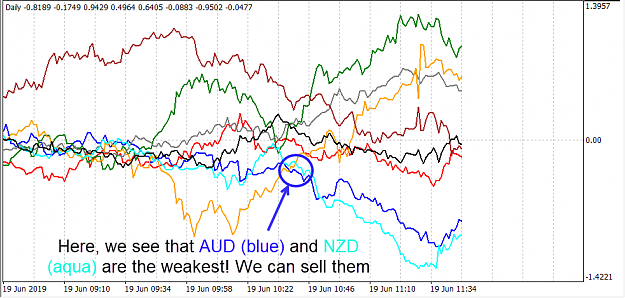
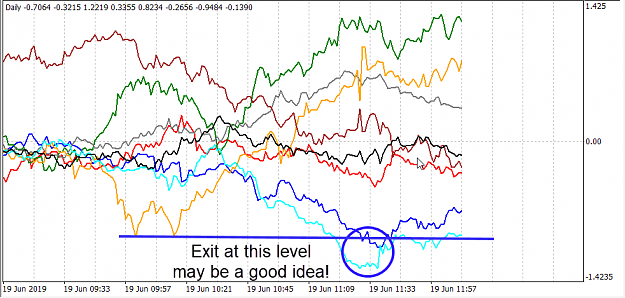
As an example of buying / selling a currency, here is AUD and NZD. Today (19 June 2019), at 10:40', the indicator shows that AUD and NZD were getting weaker and so we could sell one or both of them. image If we were going to sell AUD, we should ...
An indicator for the strength of a currency
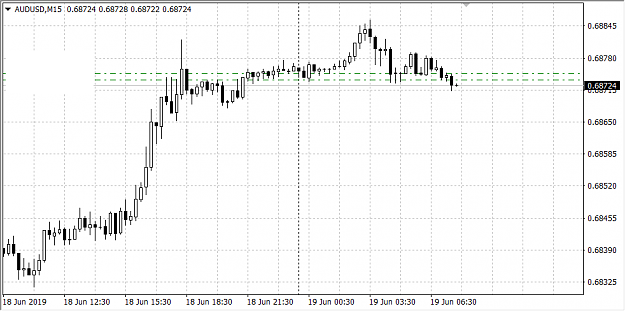
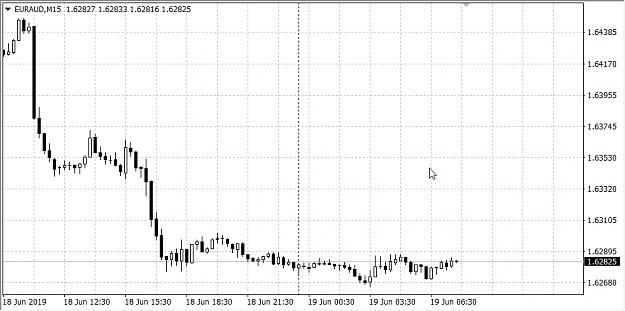
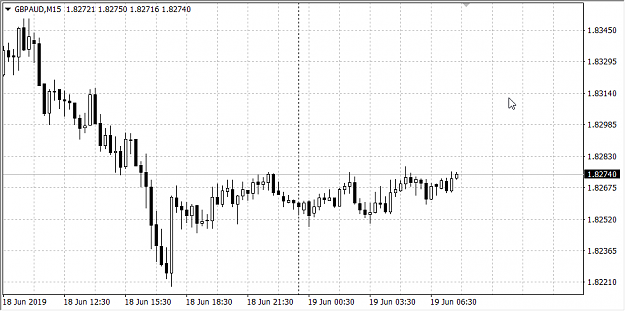
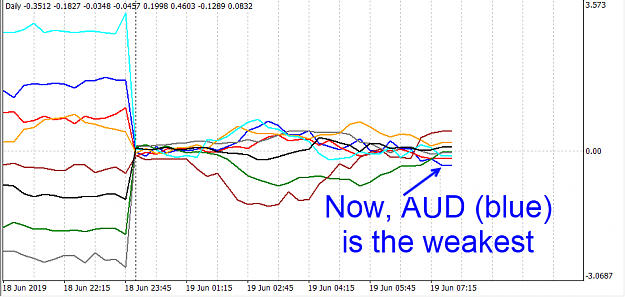
- Rafei replied Jun 19, 2019
Now AUD is the weakest. Can we trade with this signal and sell AUD? image image image image image image image image
An indicator for the strength of a currency