- Search Forex Factory
- 101 Results
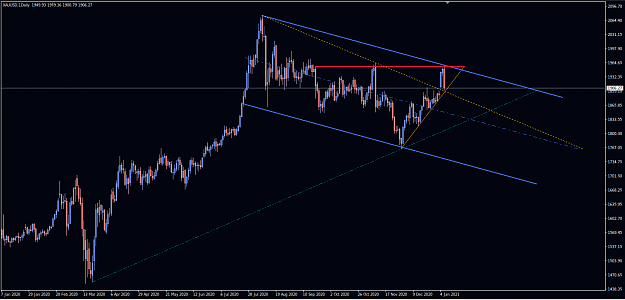
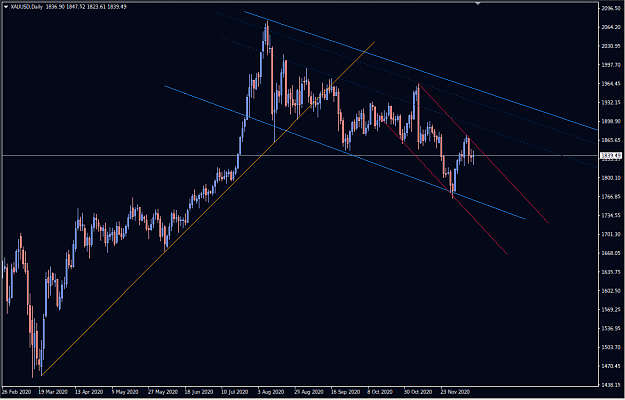
- QuantaMath replied Jan 6, 2021
Happy New Year Here is Daily chart image I think the orange line is an obstacle to downtrend , so if the price cross then the price will tend to middle line of blue channel Monday gap was crossed the golden trend line so it is another notable ...
Gold Mining - Using Each Trading Day's Trend
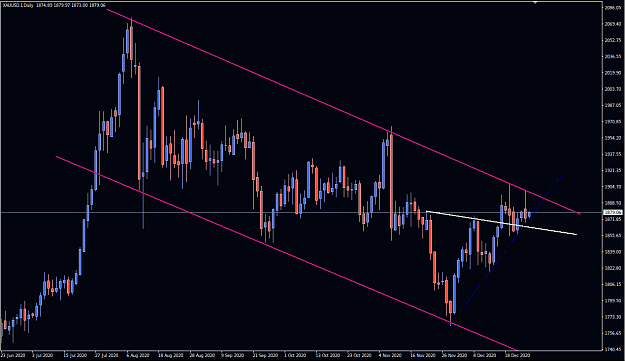
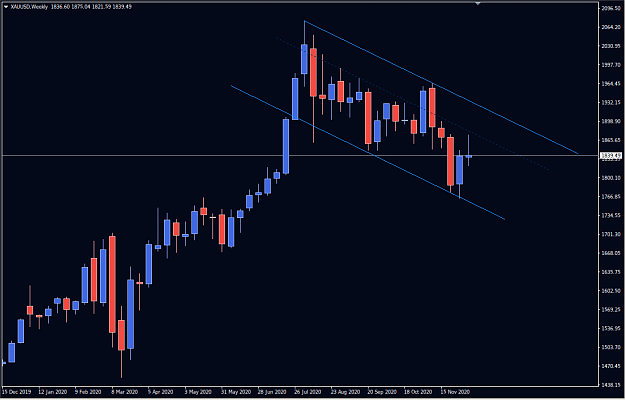
- QuantaMath replied Dec 28, 2020
D1 Chart image The market is fluctuating inside the viole channel.
Gold Mining - Using Each Trading Day's Trend
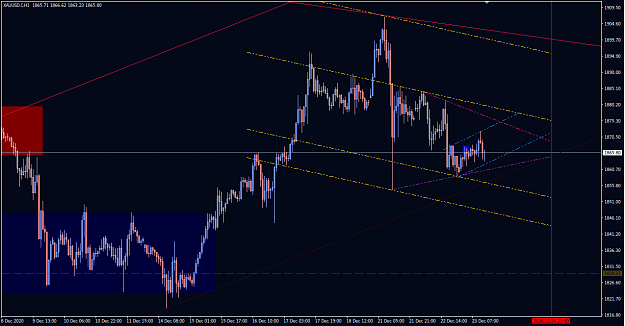
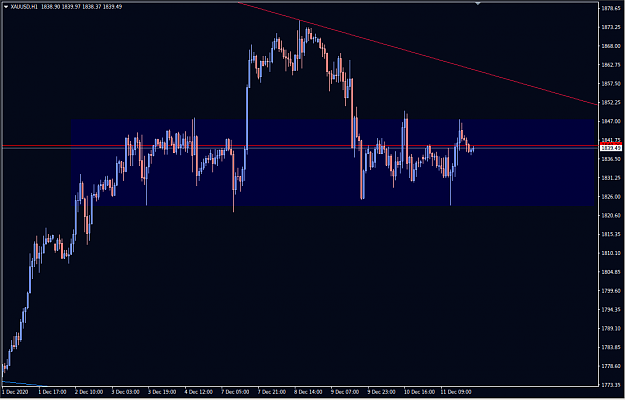
- QuantaMath replied Dec 23, 2020
H1 Chart. Just watching image
Gold Mining - Using Each Trading Day's Trend
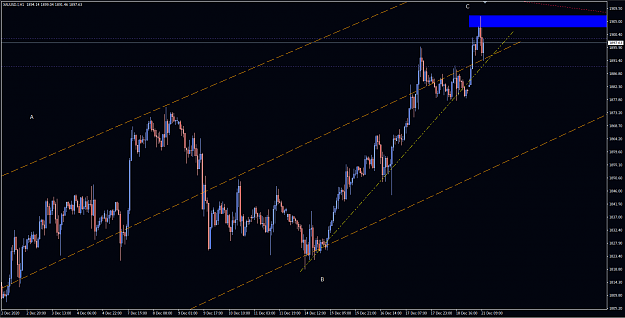
- QuantaMath replied Dec 21, 2020
H4 chart If the above trend line will got valid, then personally I will looking for change direction signal pattern in the blue rectangle for instance a double top image
Gold Mining - Using Each Trading Day's Trend
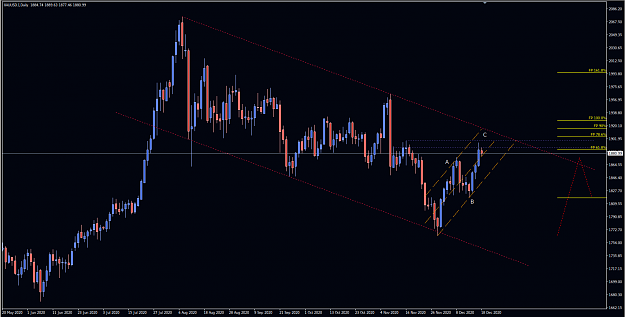
- QuantaMath replied Dec 20, 2020
D1 Chart image ** Two dotted horizontal line could be challenging area ** Also there is uncertainty based on new COVID-19 mutation, and maybe this uncertainty will be temporary. *** I think the market will open at higher price with gap
Gold Mining - Using Each Trading Day's Trend
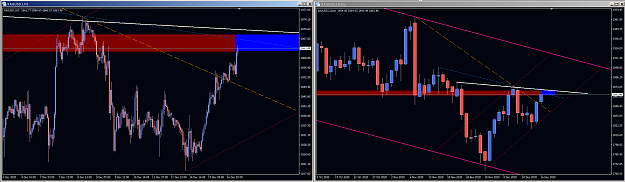
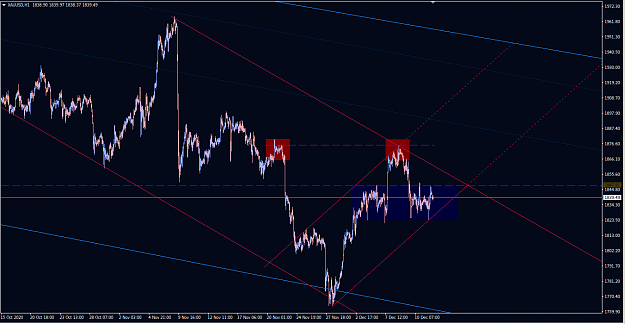
- QuantaMath replied Dec 16, 2020
The blue rectangle could be challenging area in NY time image
Gold Mining - Using Each Trading Day's Trend
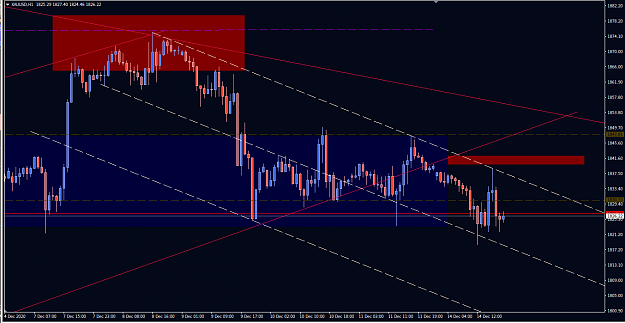
- QuantaMath replied Dec 14, 2020
H1 chart Update but only another estimation
Gold Mining - Using Each Trading Day's Trend
- QuantaMath replied Dec 13, 2020
H1 Chart (Updated) image
Gold Mining - Using Each Trading Day's Trend
- QuantaMath replied Dec 12, 2020
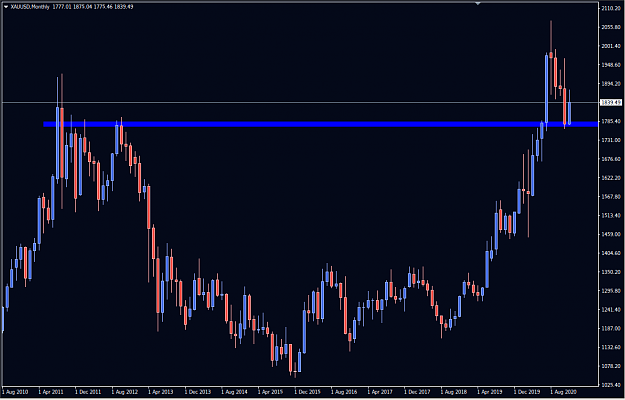
Hello The Monthly chart image
Gold Mining - Using Each Trading Day's Trend
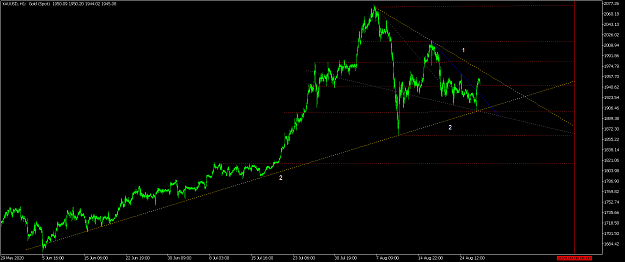
- QuantaMath replied Sep 9, 2020
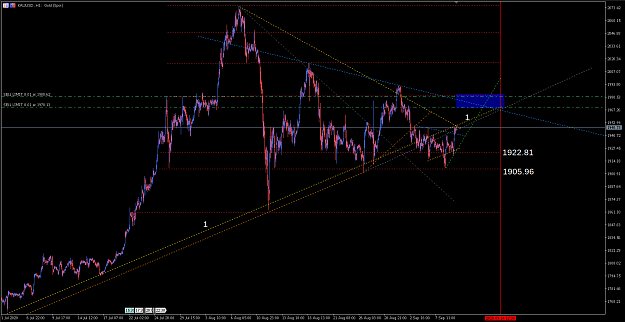
The price has reacted well at levels 1922.81 and 1905.96, I guess the market is in the pullback of the breakout of the golden trend line 1. And I guess the price could meet the area of the blue rectangle, between 1967-1981 If the price cross the ...
Gold Mining - Using Each Trading Day's Trend
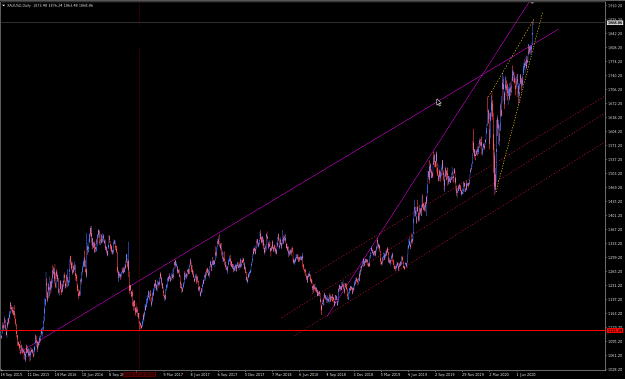
- QuantaMath replied Sep 3, 2020
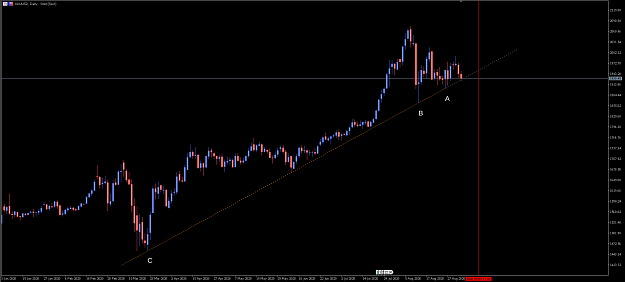
Hear is a daily chart I draw the trend line from A to B and then extended to C. The price has kissed this line four-time and did not cross unless today, I think it could a sign to bear pressure for next week. image
Gold Mining - Using Each Trading Day's Trend
- QuantaMath replied Sep 2, 2020
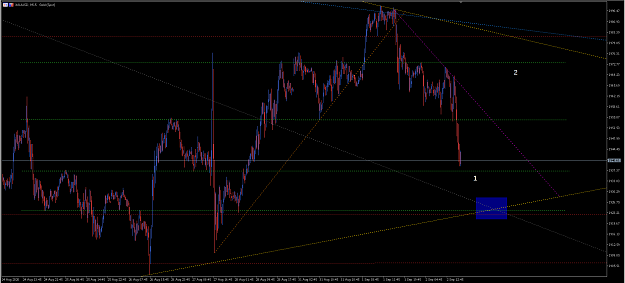
Min15 Chart Update Well the price have crossed the green horizontal line near 1955 and tend to green trend line No.1 near 1937 so this is current support and if it will cross it then the price could tend to the blue rectangle. The magenta trend line ...
Gold Mining - Using Each Trading Day's Trend
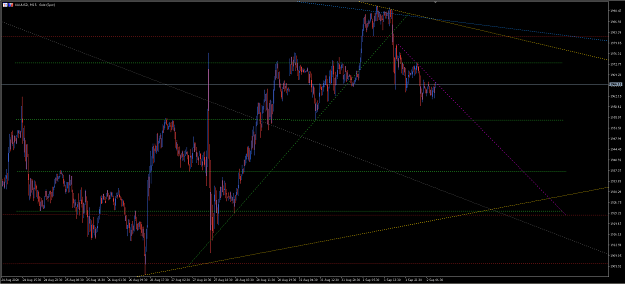
- QuantaMath replied Sep 2, 2020
Here is an update my last H1 chart image But in Min15 cahrt image The green gorizontal line are importants The magenta Trend line, if the price cross it I guess next move will the nearest green horizontal trend line: Find a resistant at this ...
Gold Mining - Using Each Trading Day's Trend
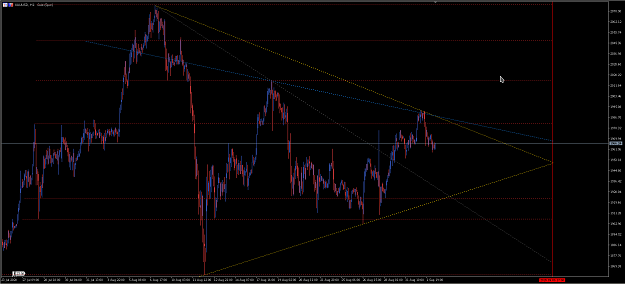
- QuantaMath replied Aug 26, 2020
Great Analysis Brother For bull move, the price need to cross the golden trend line 1 and next possible target could be the nearest brown horizontal line at above But of the price will not cross the golden trend line 1 then it will try again to test ...
Gold Mining - Using Each Trading Day's Trend
- QuantaMath replied Jul 23, 2020
Great Analysis A complement to your chart in 1D image
Gold Mining - Using Each Trading Day's Trend
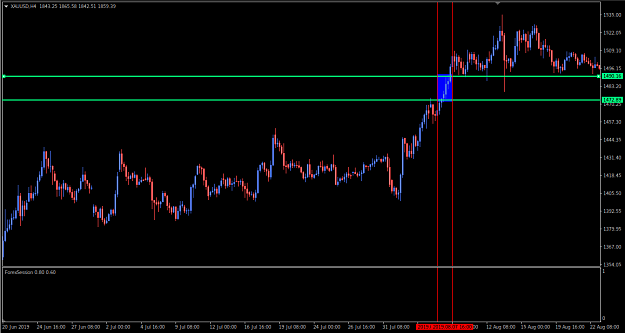
- QuantaMath replied Jul 21, 2020
It is really rare but by checking the historical data of chart, similar behavior was happened at 2019-08-7 image
Gold Mining - Using Each Trading Day's Trend
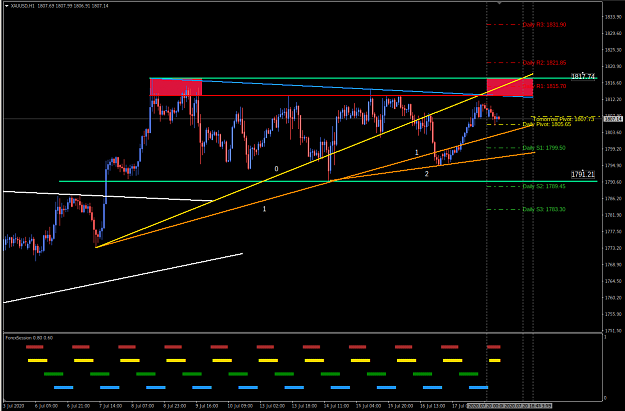
- QuantaMath replied Jul 20, 2020
Happy Monday H1 chart image The price has 4 obstacles to moving up: The golden trend line 0 The blue trend line The red horizontal trend line and the green Horizontal trend line at above The red rectangular area which if it combine with the green ...
Gold Mining - Using Each Trading Day's Trend