- Search Forex Factory
- 61 Results (1 Thread , 60 Replies )
-
 Pinhead replied Jan 20, 2021
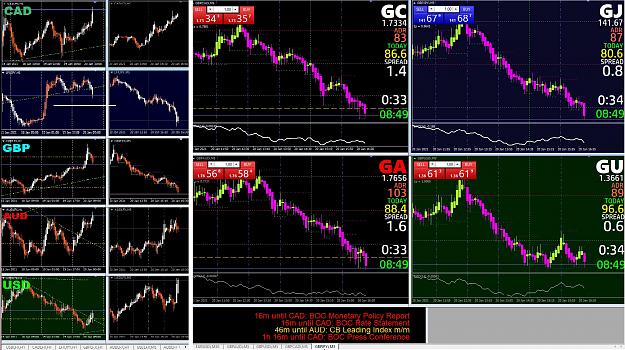
I've made some slight changes in how the charts are organized and displayed. As a full-fledged member of the ADD club, it's important to keep things as simple as possible so my brain can cope. If any others suffer from information overload when ...
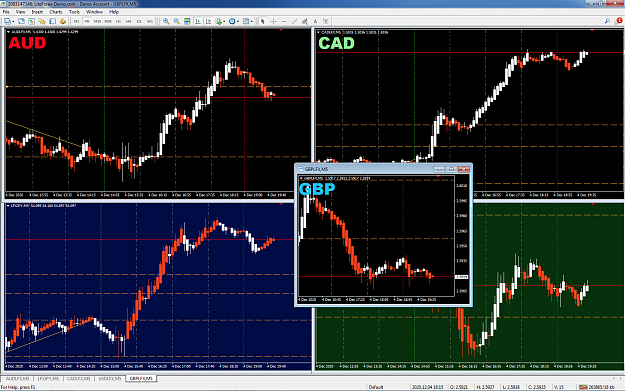
Works for me: Short-term flow
- Pinhead replied Dec 4, 2020
This system is based on short-term flow. You could even call it 'session flow'. Scalping, in effect, but with the upside of being able to stay in a trade a little--and sometimes quite a bit--longer than normal. The gist of it is that the patterns ...
Works for me: Short-term flow
- Pinhead replied Sep 8, 2015
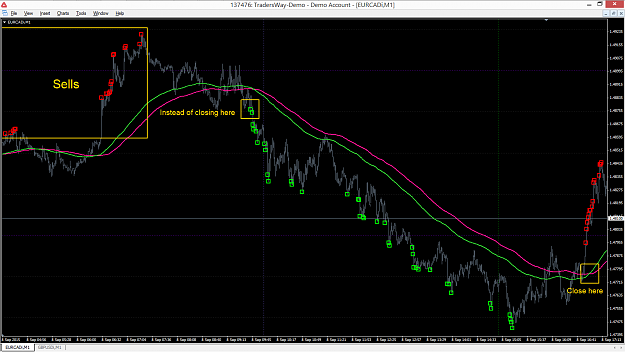
What if a moving average cross closed the basket? Obviously, manual closes would make this unnecessary, but as an option in the EA, it could be checked in Strategy Tester for viability. It seems a shame that long runs should only cause pain.
Quantum London Trading Custom EA
- Pinhead replied Mar 16, 2015
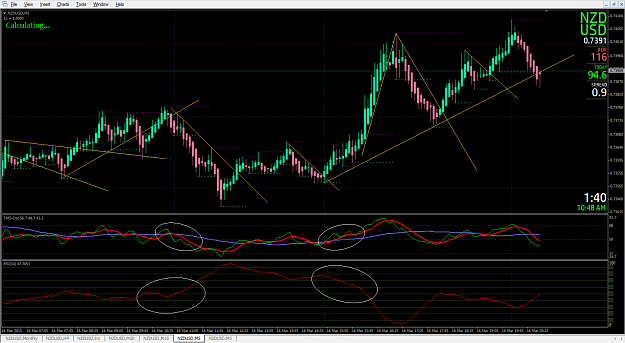
Hi OuterWest. I'm fooling around with a similar approach, but as you mentioned, the green line is nearly a carbon copy of TDI's green line, so I only use DIDI's red line, almost as a strength indicator. As much as I distrust indies, this combination ...
DIDI Trading
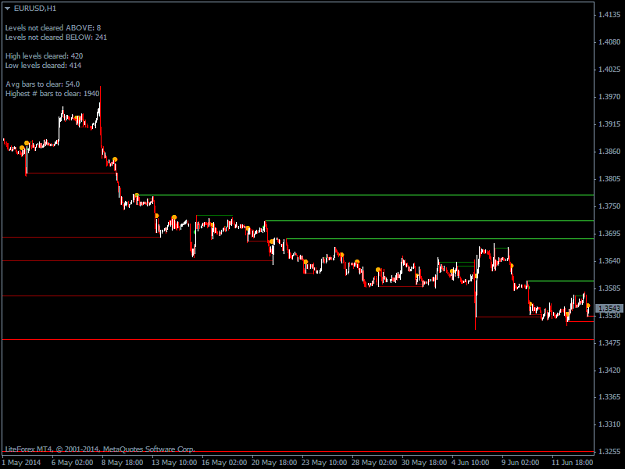
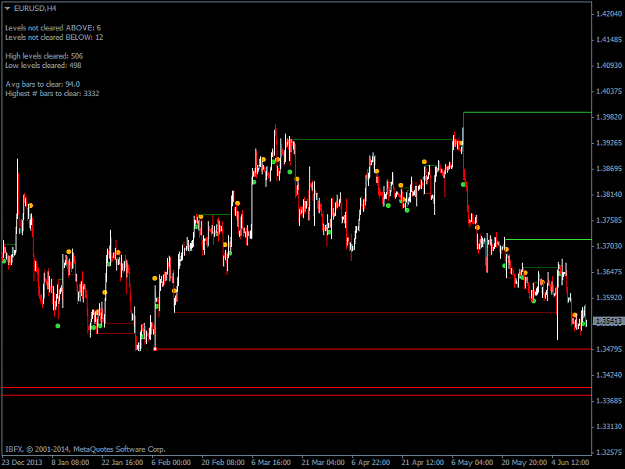
- Pinhead replied Jun 13, 2014
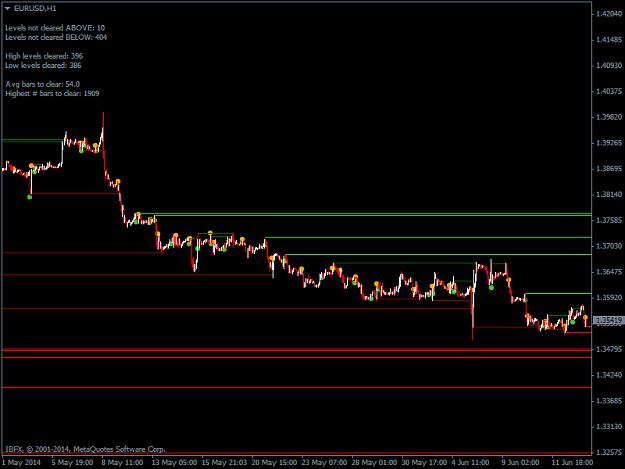
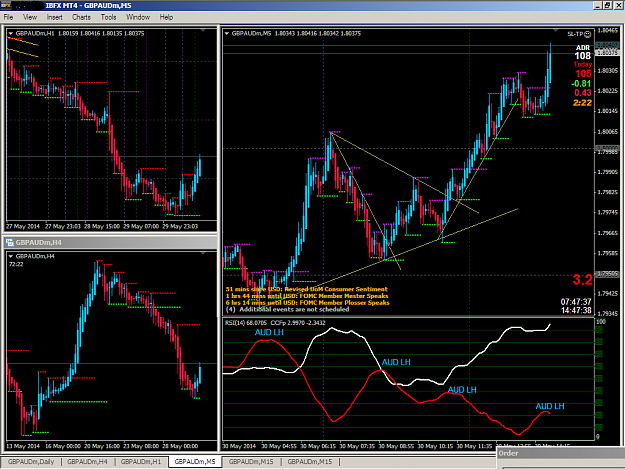
Different brokers will give different results. First chart is from broker with +0 GMT, second is +3 GMT.
A delicate secret
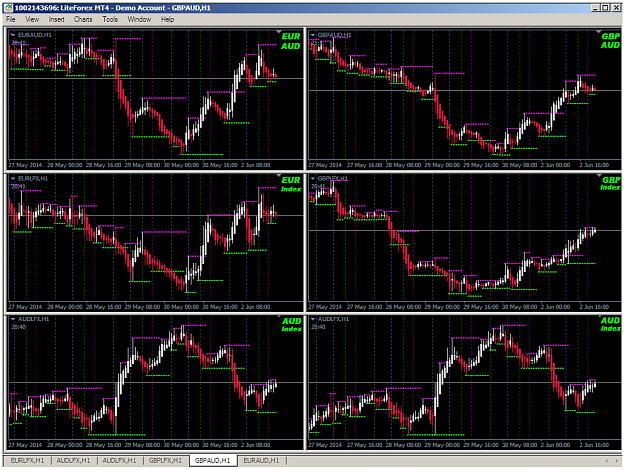
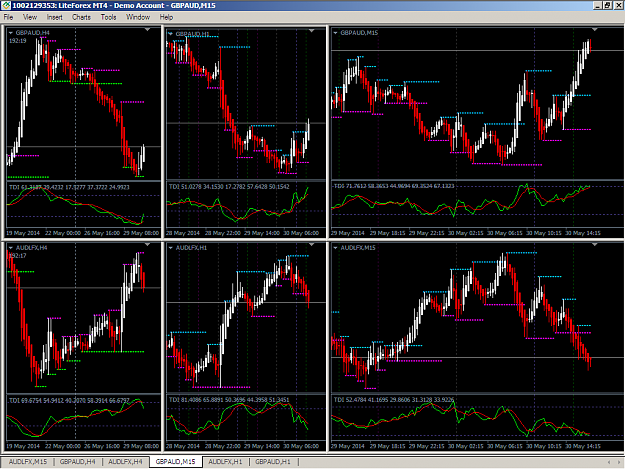
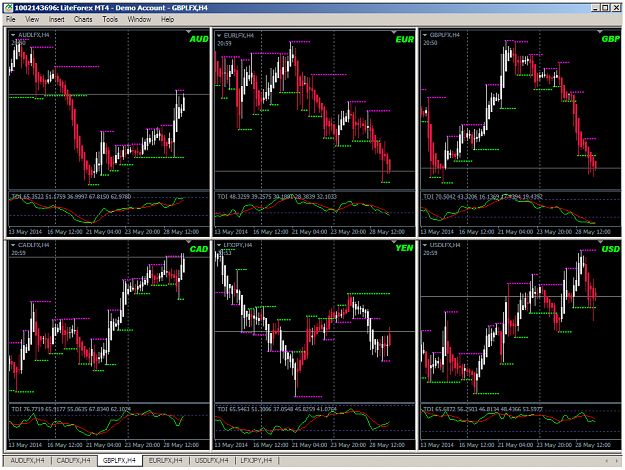
- Pinhead replied May 30, 2014
LiteForex uses their own unique way of calculating the indices. url I can't say if it's the best way to do it or even if there is a best way. All I know is that I like the way it's displayed, ie in bar chart form, which just makes things much ...
Currency index trading experience
- Pinhead replied May 29, 2014
I've been trying to find an advantage to using individual currency strength for a couple years now, using everything from CCFp to 'strength meters' to SIG Trader indices. I've settled on CCFp and SIG, mainly because of their visual simplicity and ...
Currency index trading experience
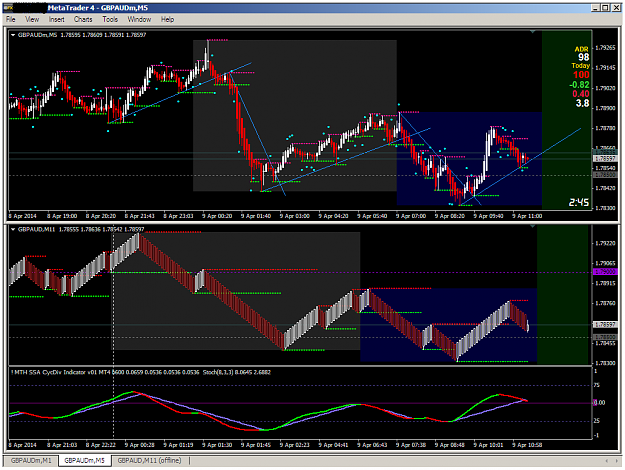
- Pinhead replied Apr 9, 2014
This chart configuration helped me see the relationship between SSA/Georenko and conventional price movement more clearly by viewing SSA as a 'leading' indicator, with higher lows/lower highs being the confirmation. When compared to the HLs/LHs on ...
MTH Accel Shift- Advance Renko Trading System (ARTS) MT4 b600
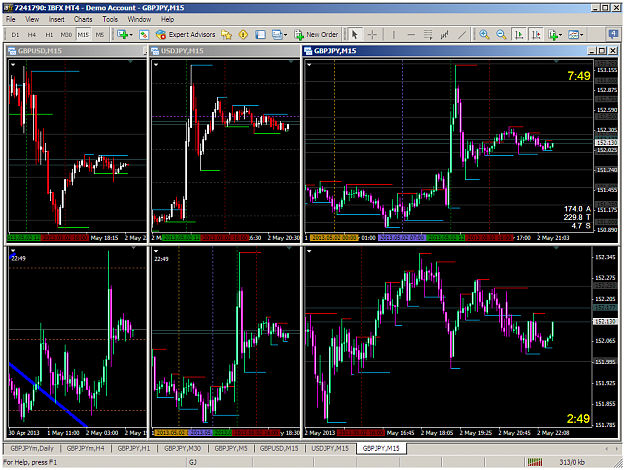
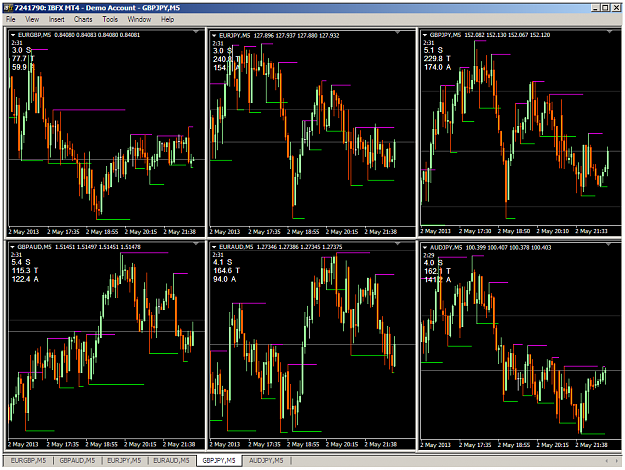
- Pinhead replied May 2, 2013
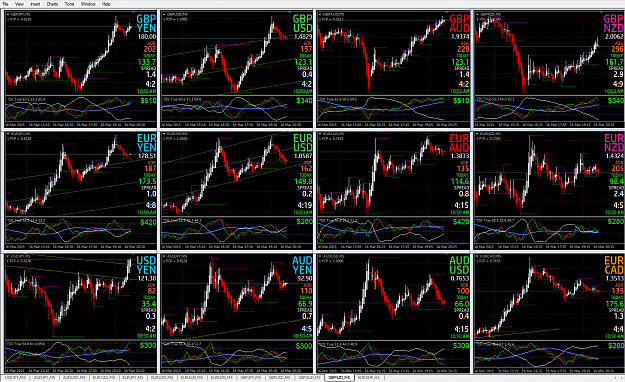
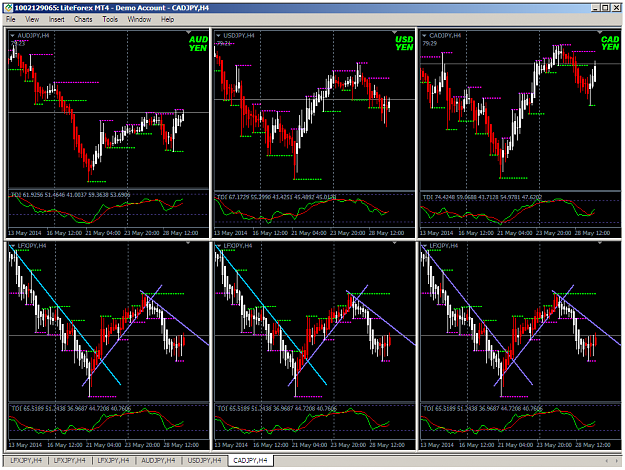
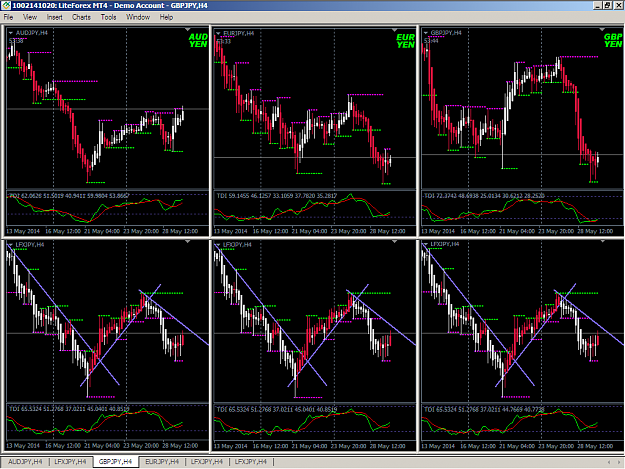
Hey unknown, if you're still around, here's a question: I'd like to focus on just 3 Yen crosses for the time being--the AUD, EUR and GBP. I 'triangulate' each pair thusly: XU, UJ, XJ, with a separate chart with EURGBP, EURAUD and GBPAUD to determine ...
Money flows: Trading the strongest / weakest major currency cross
- Pinhead replied Nov 20, 2012
Could be looking at a bounce off the lower channel line. This is the Core5 chart.
Still Basketting
- Pinhead replied Nov 14, 2012
Just closed buy at +822 (two five-pair baskets: GJ, EJ, AJ, CADJ & CHFJ), based on Yen weakness. Was in an 'iffy' long basket from late NY session yesterday and added a second basket about an hour and a half into Asia, when HAS went all-green & ...
Still Basketting
- Pinhead replied Nov 9, 2012
Be aware that it's on the quick side, so if you use it for entering reversals of the bigger trend, considerably smaller stops are probably a good idea. Could be handy for re-entering, though. I'm still fiddling with it. Will adapt it to higher TFs ...
Still Basketting

- Pinhead replied Nov 9, 2012
I'm on board, too. Yen and $ both showing weakness across all pairs.
Still Basketting
- Pinhead replied Nov 7, 2012
Since there is so much talk about how to determine overall market sentiment, I thought I'd post this fairly simple method I've begun using to help figure it out--call it a filter. One profile is Yen pairs, the other is Dollar pairs, 15M. The HAS is ...
Still Basketting

- Pinhead replied Nov 2, 2012
Looks like the grail, kos.
Still Basketting Nice work.
  on the basketv6 indi. Awesome tool. Just demo'd my first basket. Waited for NFP effect to shake out and $ index to start another 15M leg up before placing sell basket. Gonna leave this one open over ...
- Pinhead replied Nov 13, 2011
Glad you got it squared away, Mark.
Looking for GBP Index - is it available? These index charts are very nice to have, in my opinion, and I'd like to explore ways to use them. You can see on that screenshot I posted that I'm just using stochs on a 15M chart. The arrows are stoch ...