- Search Forex Factory
- 28 Results
-
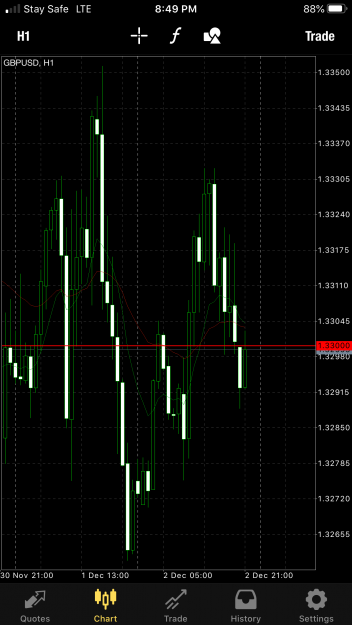
 Olabanji-Tex replied Dec 2, 2021
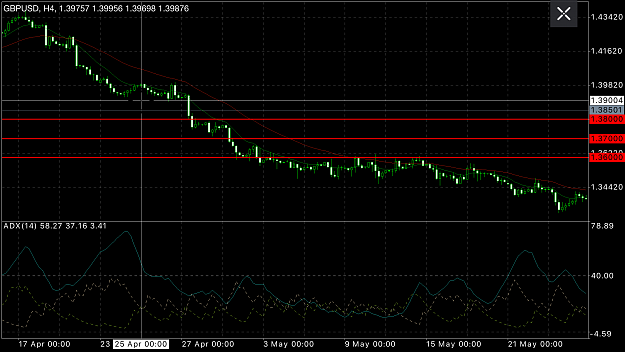
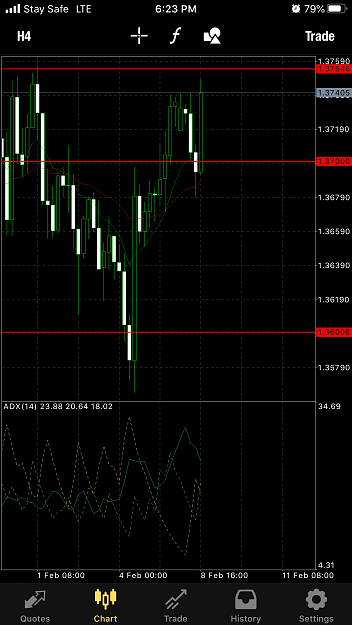
I think there is small difference in the way the mobile MT4 and PC MT4 displays the candlestick chart. Here is a an image from my phone’s MT4 showing double bottom on GBPUSD.
Cable Update (GBPUSD)
- Olabanji-Tex replied Nov 18, 2021
Hello Everyone, What I see in the attached price chart of Pound-Dollar is a gradual change in the direction from downtrend to uptrend. But the market is hard to predict accurately. Some ForexFactory GBPUSD thread members think the price will drop ...
Cable Update (GBPUSD)
- Olabanji-Tex replied Nov 8, 2021
Inverse Head and Shoulders Pattern on H1 - GBPUSD
Cable Update (GBPUSD)
- Olabanji-Tex replied Nov 5, 2021
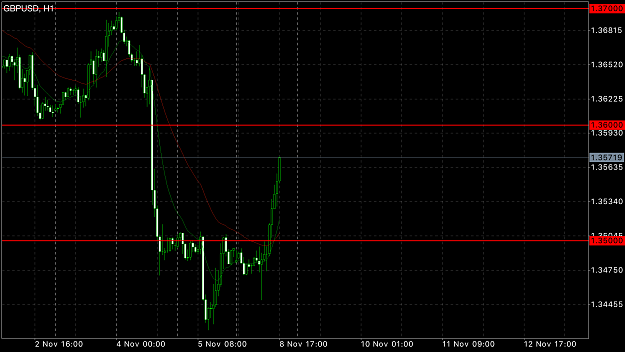
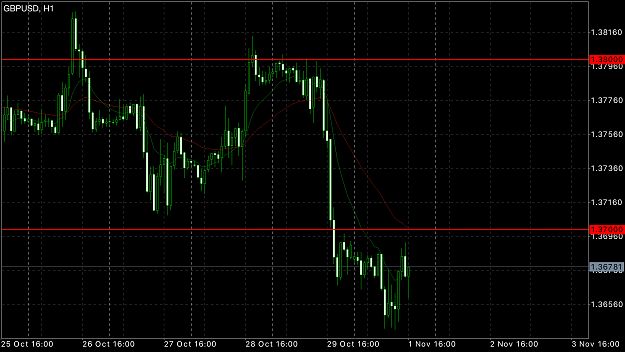
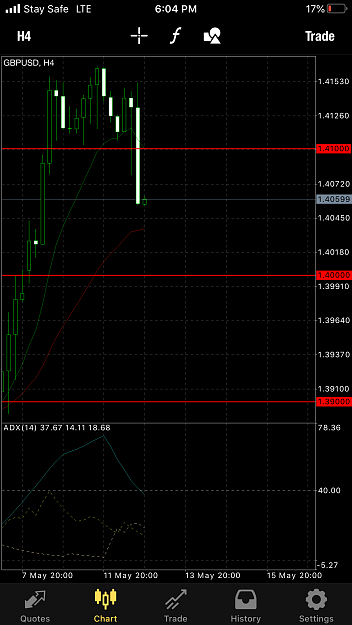
Hello everyone, I think the NFP news did not do much in changing the price and causing volatility (speaking about GBPUSD only). I am not sure about the direction of the price but if it continues to go South, it may be wise to wait for a retracement ...
Cable Update (GBPUSD)
- Olabanji-Tex replied Nov 1, 2021
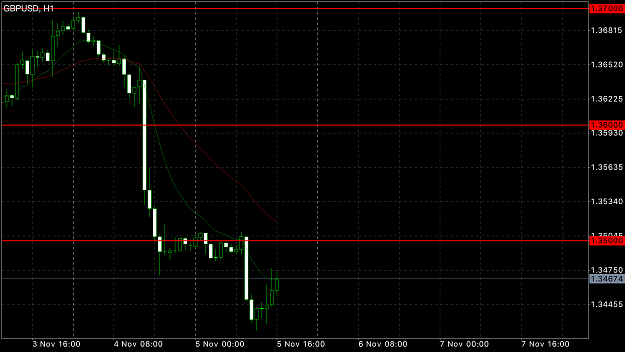
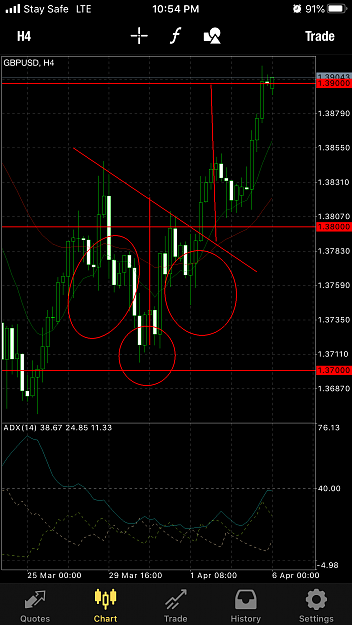
Hello, I think there is a possibility that we have an AB=CD harmonic pattern on the 1-hour chart of GBPUSD. This gives a signal to buy. Please guys, try to indicate if you share the same view. Thanks. Trade Safely with Stop Loss.
Cable Update (GBPUSD)
- Olabanji-Tex replied Jun 30, 2021
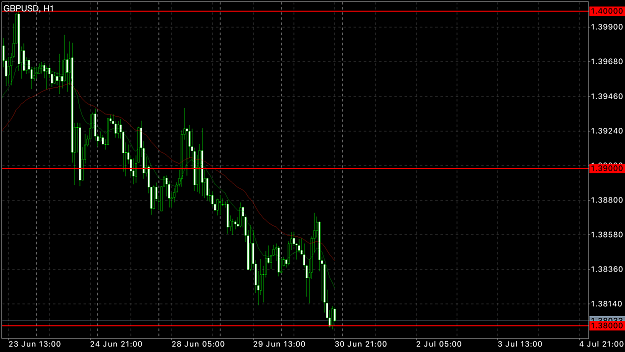
Hello guys, I am trying to find out whether the 1.3800 mark or level will be a reversal level for GBPUSD... Please share your views. Thanks.
Cable Update (GBPUSD)
- Olabanji-Tex replied Jun 8, 2021
Hello guys, The GBPUSD price went south at the beginning of the European session. But now it is picking up and going north. Lets see whether it will reach 1.4180 resistance zone. Please trade safely.
Cable Update (GBPUSD)

- Olabanji-Tex replied May 12, 2021
Hello guys, Check out this 4-hour chart of GBPUSD that I attached. We might have a head and shoulders pattern on this chart, who knows. Please trade safely.
Cable Update (GBPUSD)
- Olabanji-Tex replied Apr 5, 2021
Hello guys, I think a head and shoulders pattern was just completed on the 4-hour chart of GBPUSD. Check this chart that I have attached.
Cable Update (GBPUSD)
- Olabanji-Tex replied Mar 4, 2021
Hello guys, There is formation of a possible inverted head and shoulders pattern on the 4-hour chart of GBPUSD. At the beginning of Jerome Powell’s speech, the price was seen to move upwards but it later moved downwards at the closure of his speech. ...
Cable Update (GBPUSD)
- Olabanji-Tex replied Mar 4, 2021
Hello guys, It looks like we may have an inverted head and shoulders pattern on the 4 hour chart of GBPUSD. Nothing is confirmed yet but let us see whether this pattern will develop. Please trade safely.
Cable Update (GBPUSD)
- Olabanji-Tex replied Mar 3, 2021
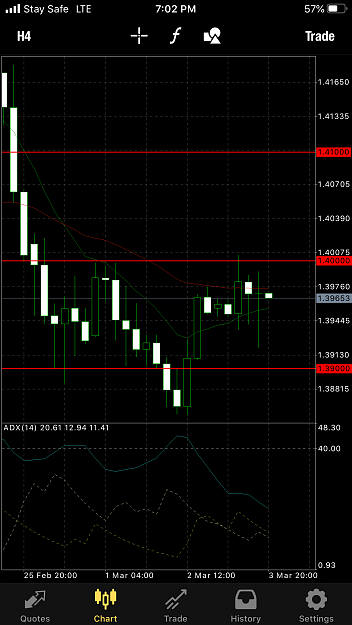
Hello guys, It seems the price is still moving in a range. It seems to be bounded by the 1.3900 and 1.4000 price levels. Check out this dragon fly doji that formed on the 4-hour chart of GBPUSD. Please trade safely.
Cable Update (GBPUSD)
- Olabanji-Tex replied Mar 2, 2021
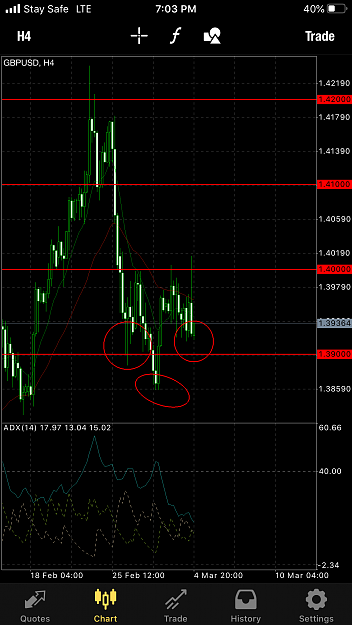
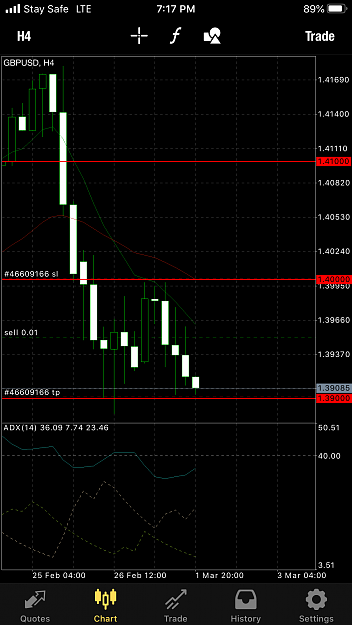
Hello guys, I have attached an image to this post. Could this be a double bottom pattern developing on the 4 hour GBPUSD chart? Let’s see how it goes.
Cable Update (GBPUSD)
- Olabanji-Tex replied Mar 1, 2021
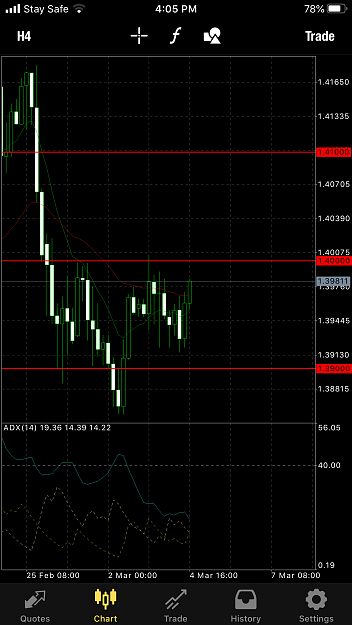
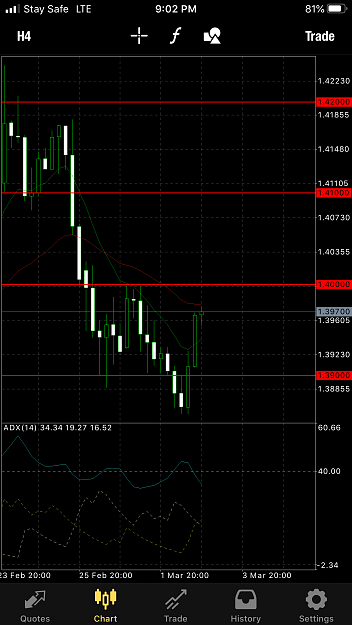
Hello everyone, I think the GBPUSD price is trading between the 1.3900 and 1.4000 price level. Check out this 4 hour GBPUSD chart that I posted.
Cable Update (GBPUSD)
- Olabanji-Tex replied Feb 11, 2021
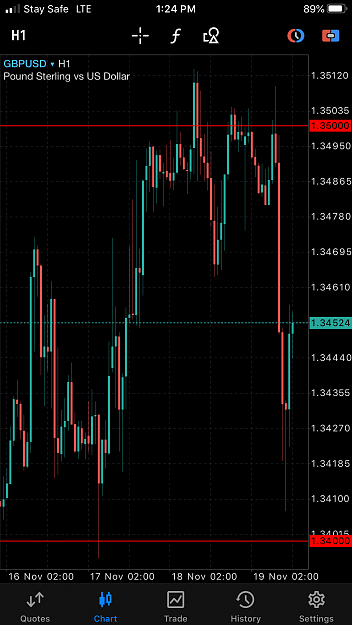
GBP/USD TESTING 1.3800 LEVEL GBP/USD has dropped back to test the 1.3800 level from AsiaPac highs above 1.3850. Dip-buyers might be waiting for the pair to drop back to support at the 1.3760 level to add to positions. Position adjustment following ...
Cable Update (GBPUSD)
- Olabanji-Tex replied Feb 10, 2021
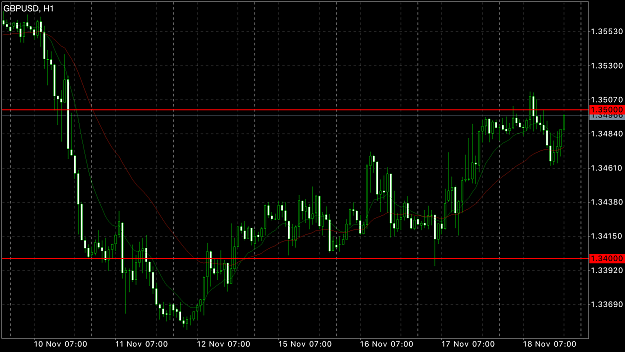
Hello guys, The price has been moving up since morning. I think the next resistance is at 1.3900 The last time the GBPUSD market traded in this area was in 2018. The market is trading at 2-year high. Check out this 4-hour chart of GBPUSD from 2018. ...
Cable Update (GBPUSD)
- Olabanji-Tex replied Feb 8, 2021
Hello everyone, The NFP news last week did not do much in propelling the Pound-dollar pair to greater highs. Although the price moved higher, it came back below 1.3700 at the early hours of Monday, 8th of February, 2020. I had to close my trade at ...
Cable Update (GBPUSD)
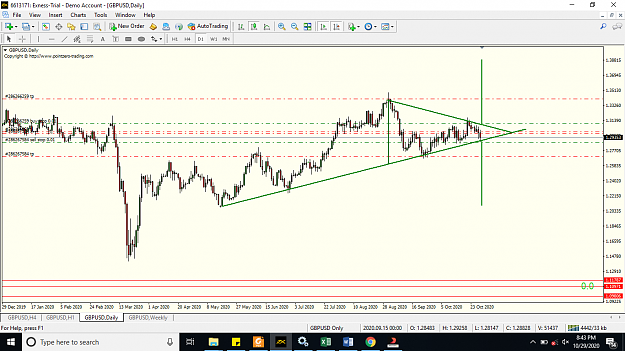
- Olabanji-Tex replied Nov 4, 2020
Hello guys, I don't think the pattern on the daily chart of GBPUSD is a symmetrical triangle. Although the pattern seems to still be developing, I think some important levels have been missed. Please what do you guys suggest? Should I wait a little ...
Cable Update (GBPUSD)
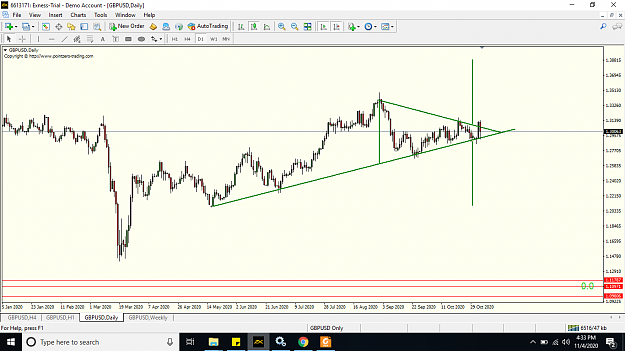
- Olabanji-Tex replied Oct 29, 2020
Hello everyone, Please does anyone see a symmetrical triangle on the daily chart of GBPUSD? Please share your views. Thanks in advance.
Cable Update (GBPUSD)