- Search Forex Factory
- 256 Results (2 Threads , 254 Replies )
-
 NikolaFX replied Apr 2, 2015
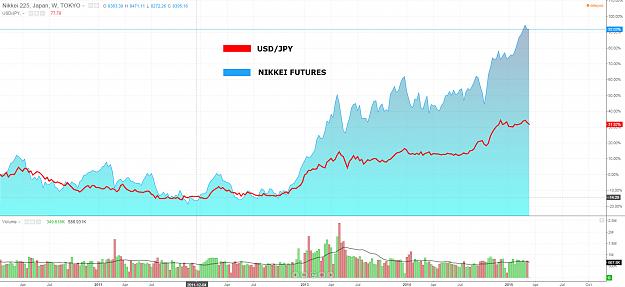
Let's continue then if everything is clear. FINANCIAL CORRELATIONS Here we have various correlations. From currencies,stock market,bonds and etc. Today I will focus on negative correlation among JPY (japanesse jen) and Nikkei 225 (japanesse stock ...
Ameba PRO Strategy -|Trading as Investing|- 3 birds of wisdom
- NikolaFX replied Mar 24, 2015
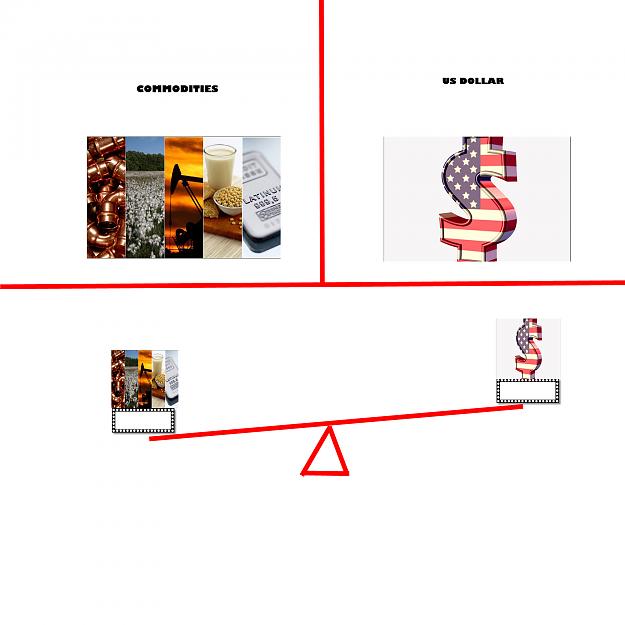
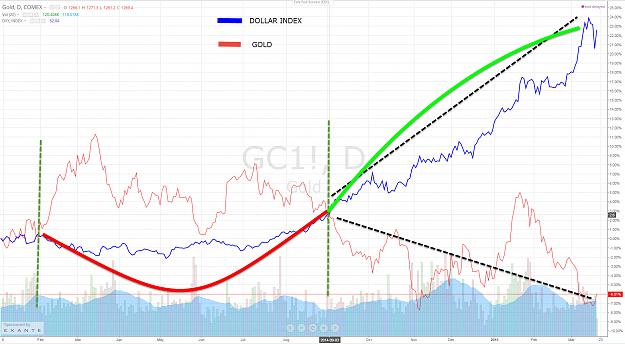
I will describe now one cycle in the FX. That is the cycle USD vs commodities. On one side we have commodities like oil,gold,copper,agriculturs ,etc and on the other side we have usd. We have that negative correlation commodities VS USD. On forex ...
Ameba PRO Strategy -|Trading as Investing|- 3 birds of wisdom
- NikolaFX replied Mar 19, 2015
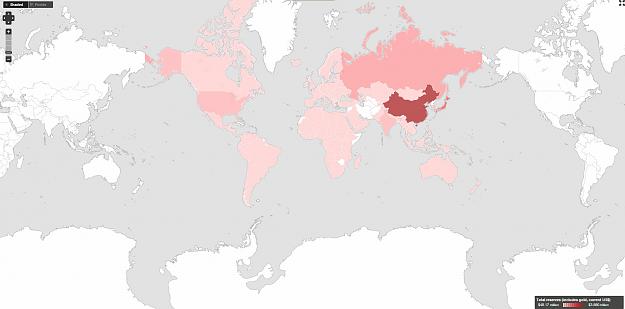
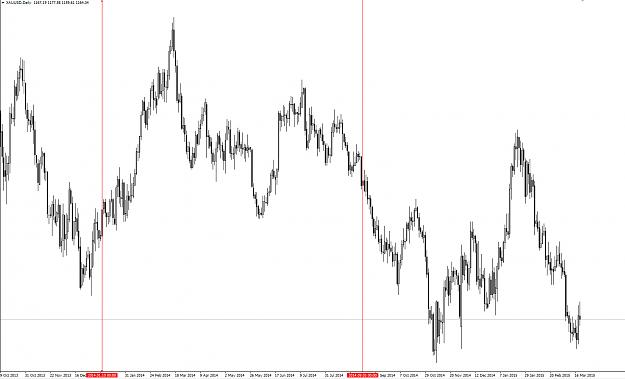
One more from "RAW MATERIALS" but they are all under commodities. After this,before financial correlations, you will be able to get clue about one cycle and I will connect the dots and expain it here that. So next is our precious metal GOLD ! And ...
Ameba PRO Strategy -|Trading as Investing|- 3 birds of wisdom
- NikolaFX replied Mar 18, 2015
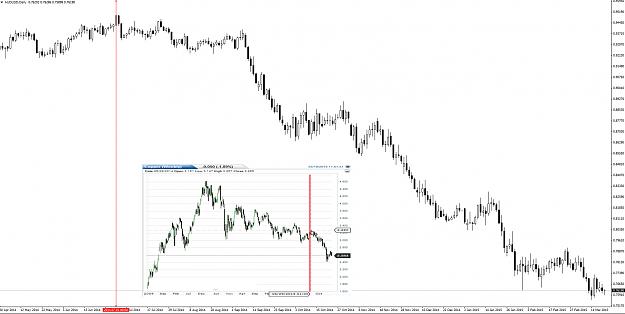
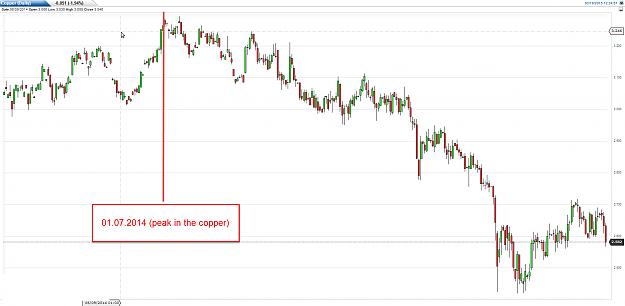
Today we will continue Australia and copper Today we will see correlation among australian dollar and copper . Australian economy is mostly based on mining industry and manufacturing. Australia is a big exporter to at first China, then Japan, Korea ...
Ameba PRO Strategy -|Trading as Investing|- 3 birds of wisdom
- NikolaFX replied Mar 16, 2015
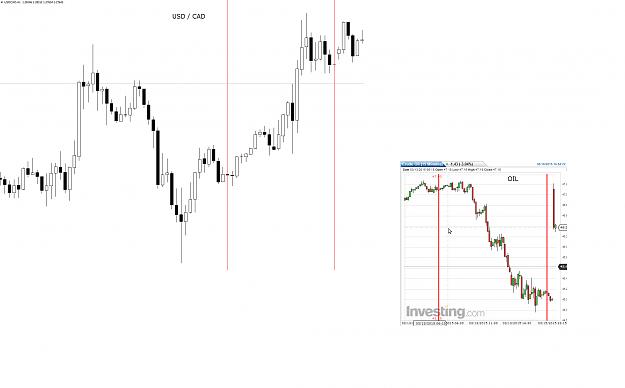
By the way. On Friday oil fell strongly and CAD followed really greatly. USD/CAD 130 pips rush image
Ameba PRO Strategy -|Trading as Investing|- 3 birds of wisdom
- NikolaFX replied Mar 16, 2015
image Current inflation is -0.3. Market expect tomorrow to stay at -0.3. You could see that we are well below 1.74% (average of 2010/14 year,5 year average). We are below average of 2014 as well! Below 0.52%. ECB project in 2015 that inflation ...
Ameba PRO Strategy -|Trading as Investing|- 3 birds of wisdom

- NikolaFX replied Mar 12, 2015
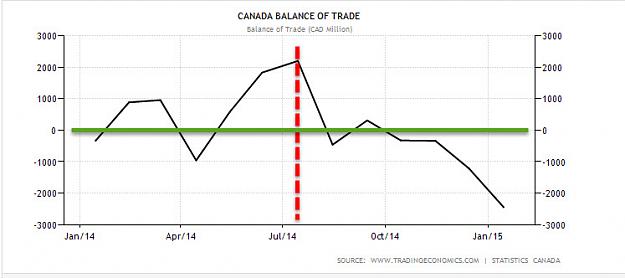
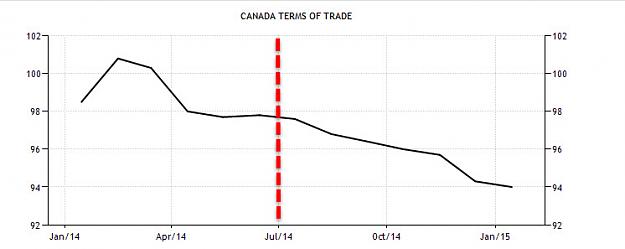
You see how at first oil affects inflation around the globe. The good thing is that we have a currency to trade ,which is directly in correlation with oil prices,that is famous CAD. Canada is oil gigant. Famous OIL SANDS!
Ameba PRO Strategy -|Trading as Investing|- 3 birds of wisdom How we come to this ? ...

- NikolaFX replied Mar 10, 2015
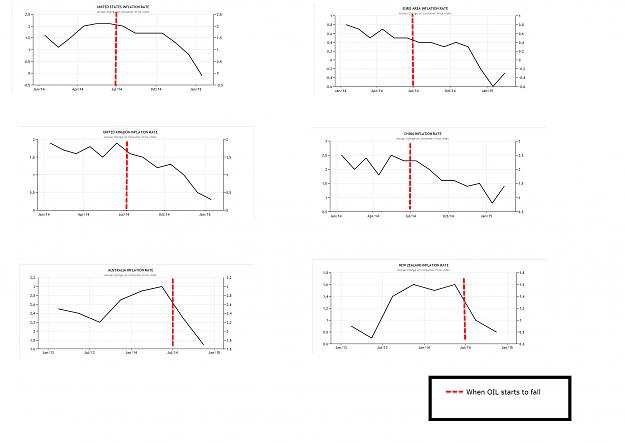
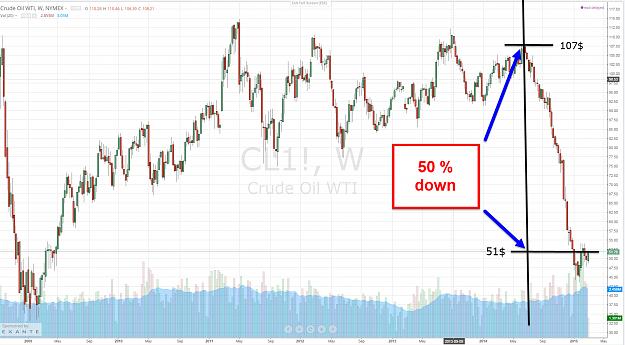
Now it is time to continue. Here is ONE more picture. From previous picture we can see a free fall of OIL prices,starting from middle of previous year. This picture shows the impact of oil prices on the inflation around the world. image You can ...
Ameba PRO Strategy -|Trading as Investing|- 3 birds of wisdom
- NikolaFX replied Mar 5, 2015
Other markets I said that market are connected very well today. There is a lot of ways to benefit from market correlations. I use a few markets , which I fully understand and they give me really good HINT what are the possible scenarios behind the ...
Ameba PRO Strategy -|Trading as Investing|- 3 birds of wisdom
- NikolaFX replied Mar 3, 2015
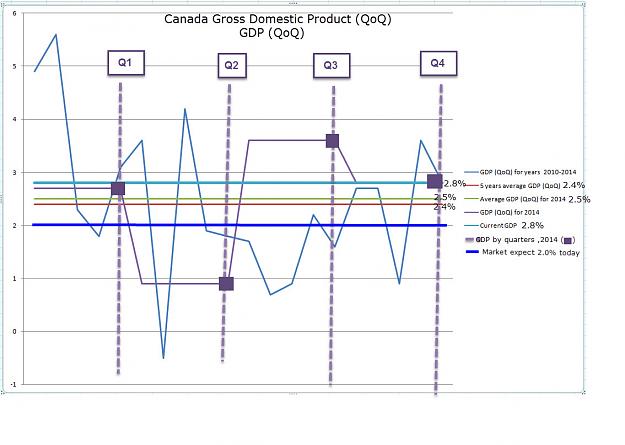
image From picture we see that current rate is 2.8! That is a good rate of GDP (QoQ) growth. Quarter contains 3 months , and it is logically that four quarter makes 12 months. Current 2.8% rate is bigger than both 5 years average (2.4%) and ...
Ameba PRO Strategy -|Trading as Investing|- 3 birds of wisdom
- NikolaFX replied Mar 2, 2015
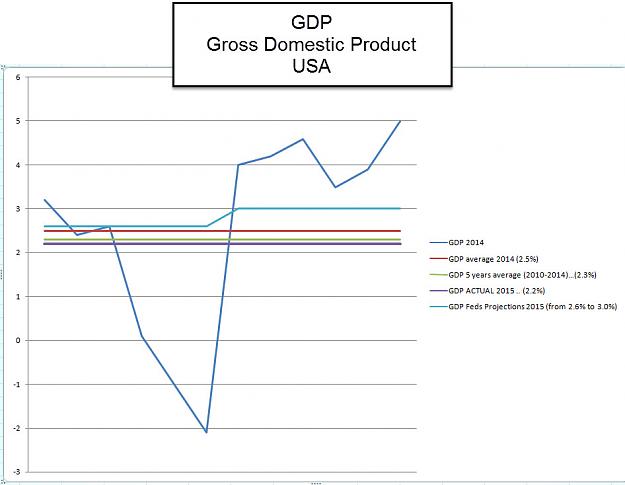
You see here some new stuffs as "Feds Projections 2015" and so on. image First I computed average movement of last 5 years (2010 ,2011 ,2012 ,2013,2014). The principle is same as I showed for 2014 average movement. You should take GDP data from ...
Ameba PRO Strategy -|Trading as Investing|- 3 birds of wisdom
- NikolaFX replied Feb 27, 2015
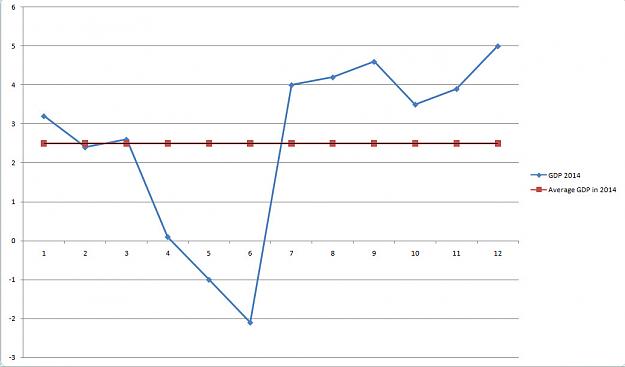
How to calculate the average movement of GDP from last year ? Take all GDP data of 2014 (starting from January to December). image You can find those numbers on any better economic calendar.including our on Forex Factory . I used ANNUALIZED GDP ...
Ameba PRO Strategy -|Trading as Investing|- 3 birds of wisdom

- NikolaFX replied Feb 26, 2015
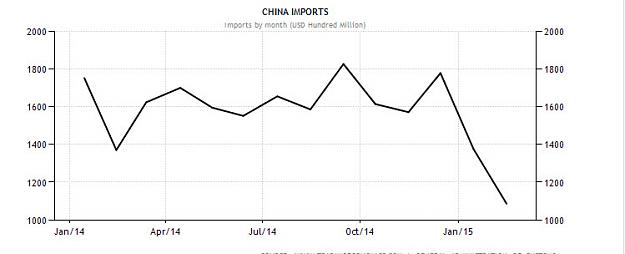
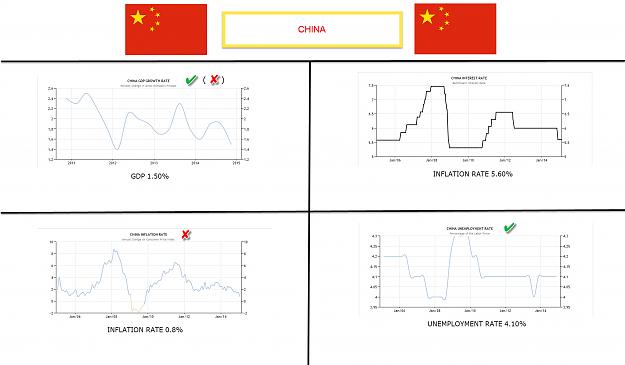
GDP is partly problem , because China is the fast growing economy, it is bigger exporter. This rate (1.5 GDP ) is good for others countries but for China it is not so alike. image
Ameba PRO Strategy -|Trading as Investing|- 3 birds of wisdom
- NikolaFX replied Feb 26, 2015
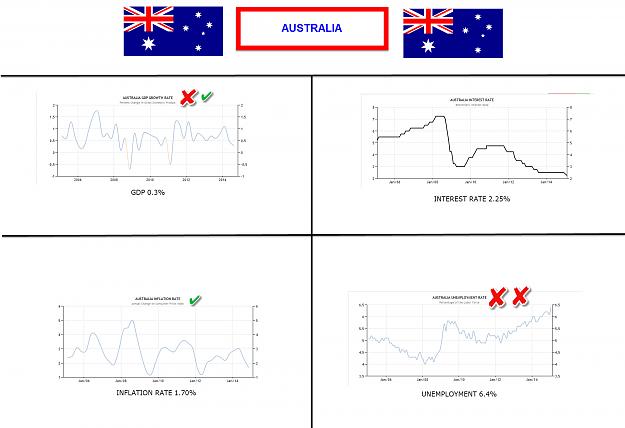
Australia High unemployment rate,growing unemployment. GDP is positive number but it is very fragile. image
Ameba PRO Strategy -|Trading as Investing|- 3 birds of wisdom
- NikolaFX replied Feb 25, 2015
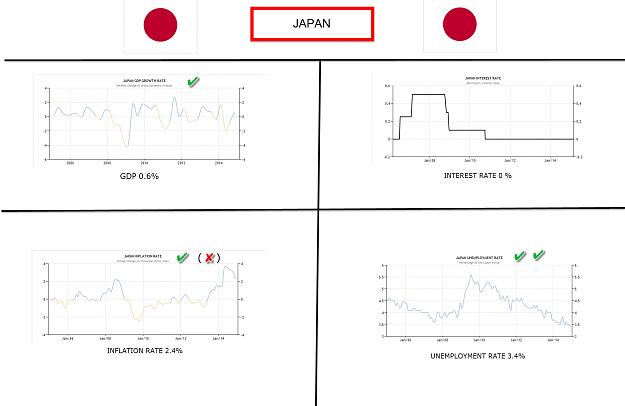
Japan . Inflation rate is the biggest problem , because of the history of Japan and fight with deflation. Inflation rate is now at 2.4% ,which is more than good but as you can see it is very volatile inflation. Make big swings. The question is ...
Ameba PRO Strategy -|Trading as Investing|- 3 birds of wisdom
- NikolaFX replied Feb 25, 2015
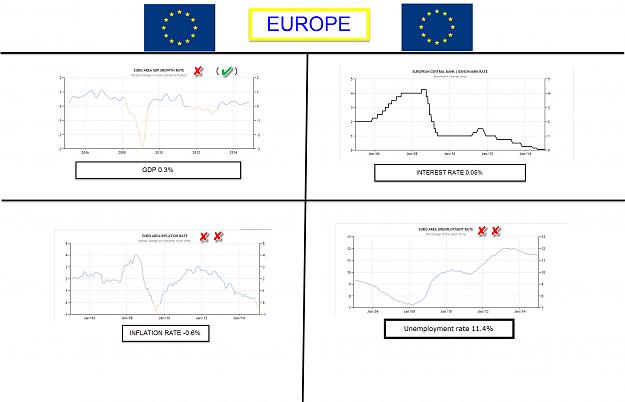
Europe. I put check mark into brackets for GDP ,becuase 0.3 is still positive number at least. But that growth rate is very very low and bad. image
Ameba PRO Strategy -|Trading as Investing|- 3 birds of wisdom
- NikolaFX replied Feb 23, 2015
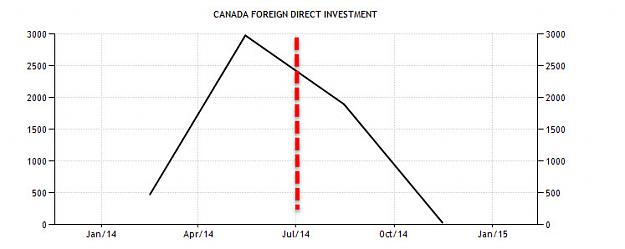
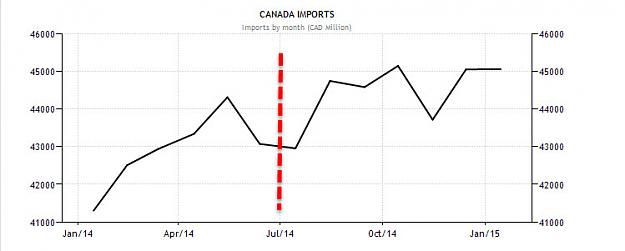
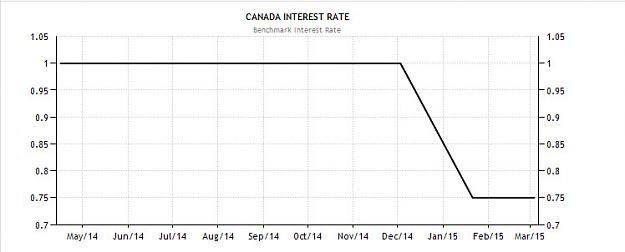
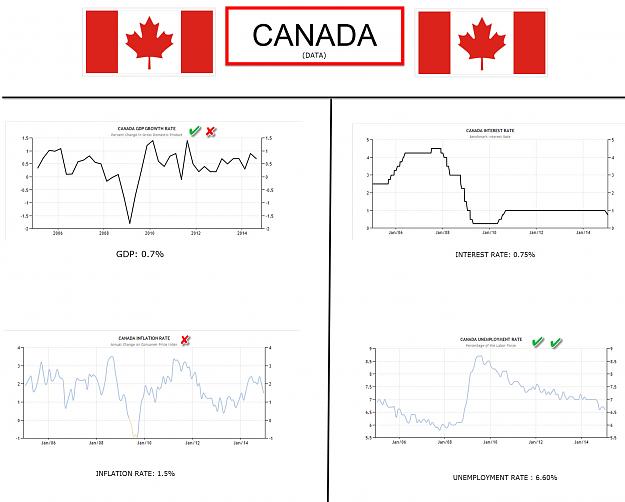
Canada ,major data. image You can see for example both checked and unchecked marks on GDP,that is because it is mixed. GDP need to gain more for sure (this rate is not that shiney) but from other side you can see that Canada always had have that ...
Ameba PRO Strategy -|Trading as Investing|- 3 birds of wisdom
- NikolaFX replied Feb 18, 2015
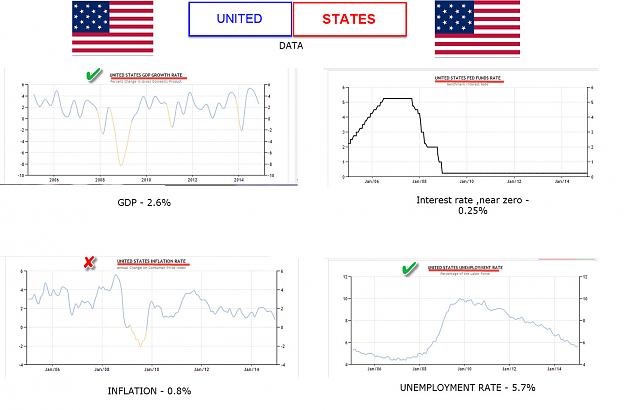
Now is time to take a look on this three indicators and interest rates for all economies (major ,advanced economies). I made a pictures.so first on the menu is USA. Take a look at marks,I marked what is good and what is not ,according to their ...
Ameba PRO Strategy -|Trading as Investing|- 3 birds of wisdom