- Search Forex Factory
- 15 Results
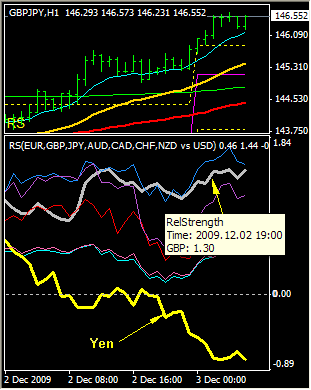
- Matsu replied Dec 3, 2009
Indicator — Maybe someone will find this indicator easier to use. Above 0 = strong; below 0 = weak. In the attached chart, the bold silver and yellow lines represent GBP and JPY respectively. If you hoover your mouse over each line you will be ...
Forexgrail excel indicator
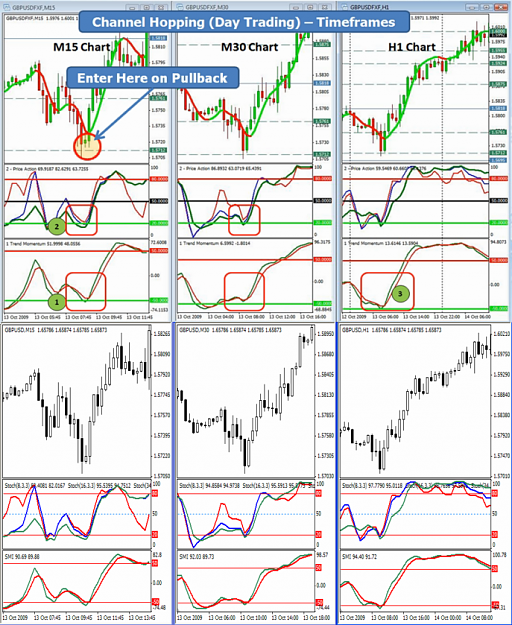
- Matsu replied Nov 30, 2009
The indicator is William Blau's Stochastic Momentum Index, set to 16, 3, 3, 3 Attached is the SMI and the template. Hope someone will find them useful.
Forex Mastery System
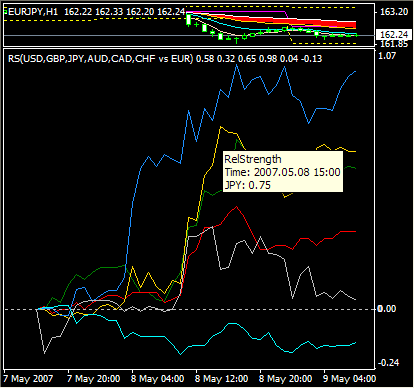
- Matsu replied May 9, 2007
I like the idea of buying the strongest and selling the weakest, but have not given a thought on how to do it. Thanks to Samuri for showing the way. I have made an indicator to show the relative strength of various currencies vs the Euro, just as ...
multi-pair percentage scale charts
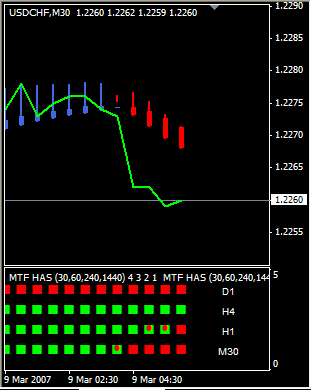
- Matsu replied Mar 9, 2007
The additional bars (actually dots) are dots which appear above the original square dots when the wick colours are different from the bar colours. Sorry. Can't find such symbol. I thought you were alright with the chart in my earlier post. How about ...
HAS Indicator - Misc indicators & EA's
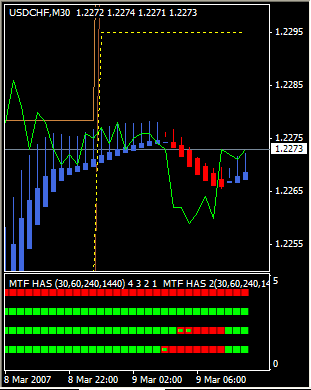
- Matsu replied Mar 8, 2007
How about this? (See attached chart) But it requires 2 seperate indicators due to MT's limitation, unless you can live with only 2 timeframes. Matsu ps. You icon is making it hard for me to resist responding
HAS Indicator - Misc indicators & EA's
- Matsu replied Jan 21, 2007
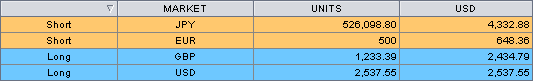
Hi howard, You are quite right. I am currently running a demo consisting of the following: L 5100 EURGBP S 5600 EURUSD L 4600 GBPJPY S 4700 USDJPY The attached chart shows the net exposure on this demo. Regards, Matsu
Swap Trading System
- Matsu replied Jan 16, 2007
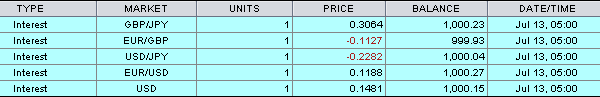
Hi howard, The increase in equity was not solely from swap interest. You can see from the attached image that the daily interest would give you only about 8% a year. I closed the positions when I saw profits, and reopened them in exactly the same ...
Swap Trading System
- Matsu replied Jan 12, 2007
I closed the demo account in December 2006 at $1147.46 Regards, Matsu
Swap Trading System

- Matsu replied Jan 12, 2007
Hi howard, PMed you the link. It is an inactive forum. I don't want to be viewed as trying to drum up membership/viewership for it. By the way, you don't need to sign up to view. By the way, I started a demo in July 2006 with a $1000 account. The ...
Swap Trading System
- Matsu replied Dec 24, 2005
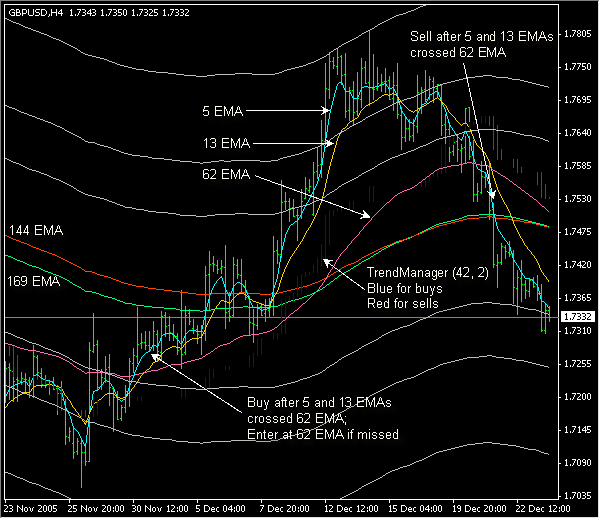
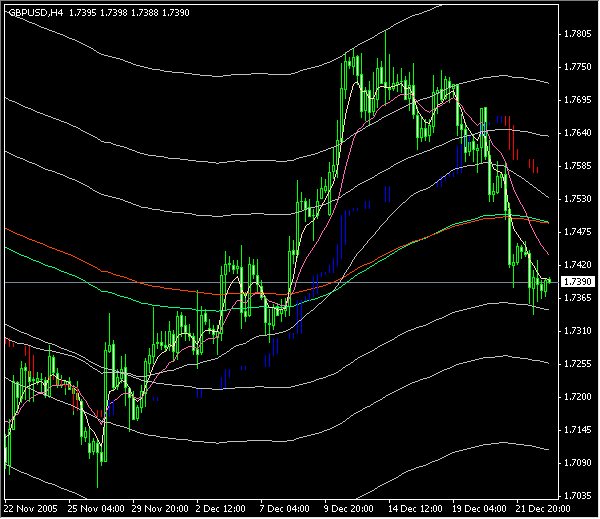
Hi Volan, I hope the chart is clearer now. This is just one possible way to use Vegas's new information. I have chosen the 5/13/62 EMA system here. Yes the blue and red bars are the TrendManager. The default setting is 7, 2. I have set it at 42, 2 ...
Lost in the Tunnel...
- Matsu replied Dec 22, 2005
Yes you are right. You will notice that the the equivalent of the daily 24/28 EMAs on the 4-hour chart is 144/168, almost the same as the 144/169 EMAs used on the 1-hour tunnel. And I prefer the 4-hour version. Add the TrendManager and 5/13/62 EMAs ...
Lost in the Tunnel...
- Matsu replied Nov 11, 2005
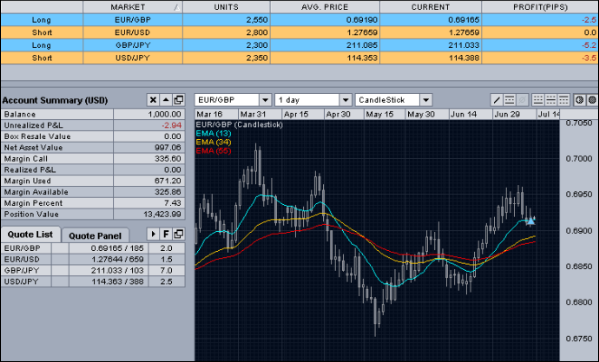
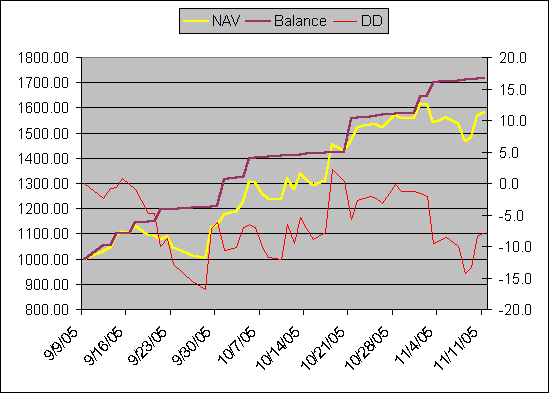
Anyone carries just 2 pairs? — I have been demoing with just 2 pairs for two months now. The result looks good so far, but it has its risks, I presume much more than carrying 10 or more pairs. The chart shows the result so far. Pairs traded: ...
Currency Basket and Carry Trading
- Matsu replied Jul 11, 2005
It is 25% (just an example) of the total open positions. Trade size is based on a percentage of the account value. I tested on several pairs, but not many. Anyway I have stopped doing it for the time being as I reckon it would require a lot more ...
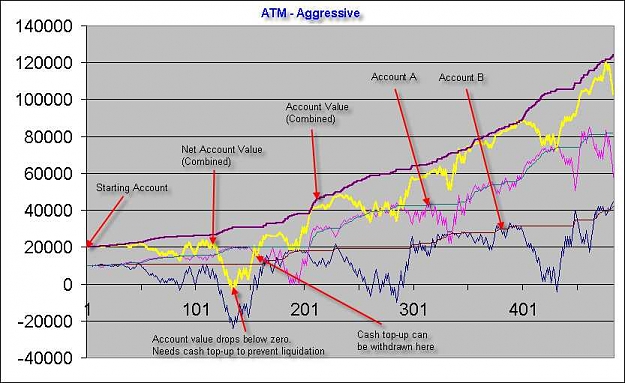
Lichello's Automatic Investment Machine
- Matsu replied Jul 7, 2005
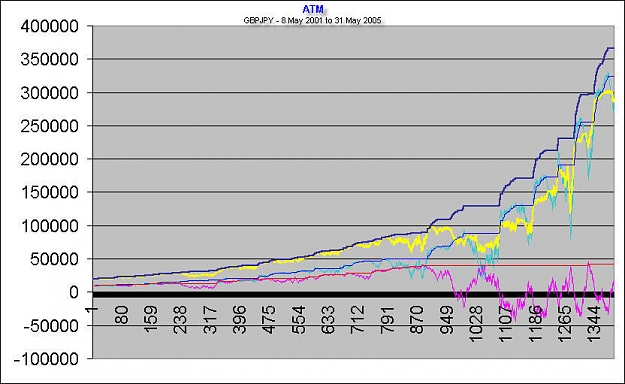
I played around on a variation of AIM recently. The attached chart is one of two I sent a friend. It was based on the grid trading method discussed on the OANDA forum http://www2.oanda.com/cgi-bin/msgboard/ultimatebb.cgi?ubb=get_topic;f=15;t=002524
Lichello's Automatic Investment Machine
- Posts by Member Search: 'Matsu'