


EUR/USD, US Dollar Talking Points:
- In related themes, the US Dollar is testing a key area of resistance as the EUR/USD tests a critical zone of support. In EUR/USD, that support is showing around the psychological 1.1000 level while the USD tests a well-worn zone of resistance after this morning’s US data outlay.
- Tomorrow brings the Thanksgiving holiday in the US and the day after is ‘Black Friday,’ which likely means a low-liquidity backdrop across global markets. But – high-impact data is on the economic calendar on both days and large beats/misses in the data can lead to big moves on the chart given the lessened liquidity that will likely punctuate the next few days of trading.
- DailyFX Forecasts are published on a variety of markets such asthe US Dollar or the Euro and are available from the DailyFX Trading Guides page.
Low Liquidity Plus High-Impact Data Brings Potential for Holiday Volatility
Tomorrow brings the Thanksgiving holiday in the United States and the day after is ‘Black Friday,’ which means we’ll likely be looking at lower-liquidity conditions in global markets into the end of this week. That does not mean, however, that there are no other items of interest as a couple of German releases are on the economic calendar for tomorrow morning; and with less liquidity in markets the potential for volatility remains, particularly if that data prints far outside of the expected range.
In the US Dollar, price action is in an interesting spot ahead of the holiday. October brought bears into the mix as the USD fell through the bottom of a rising wedge formation, but the first-half of November was marked by a return of the USD bull. Buyers pushed up to a key resistance area on the chart, and that held the highs mid-month; but sellers were unable to retain control and USD price action has shot right back up to that key area on the chart running from 98.33-98.50.
US Dollar Daily Price Chart
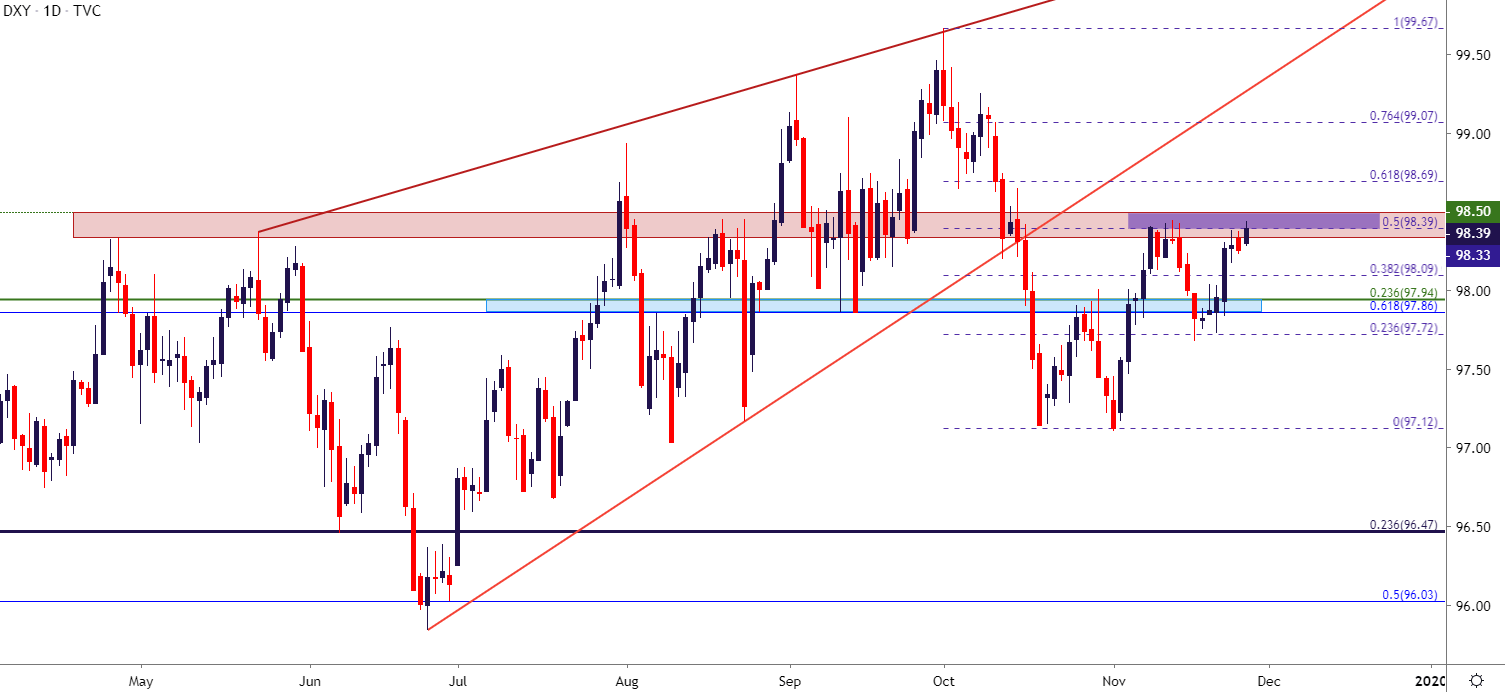
Chart prepared by James Stanley; US Dollar on Tradingview
At this stage, the frequency of those resistance revisits combined with a waning impact from sellers on each recurrent test and a topside break begins to look more likely, especially considering a low-liquidity backdrop that will likely show over the next couple of days.
If a topside break does show, the next area of interest is around the 98.70 level, taken from the 61.8% retracement of the October sell-off combined with a prior swing-low. Beyond that, the next big area on the chart is around the 99.00 level on DXY.
But, for the US Dollar to get there, it’s likely going to need a bit of help from the Euro, which will be looked at below.
US Dollar Four-Hour Price Chart
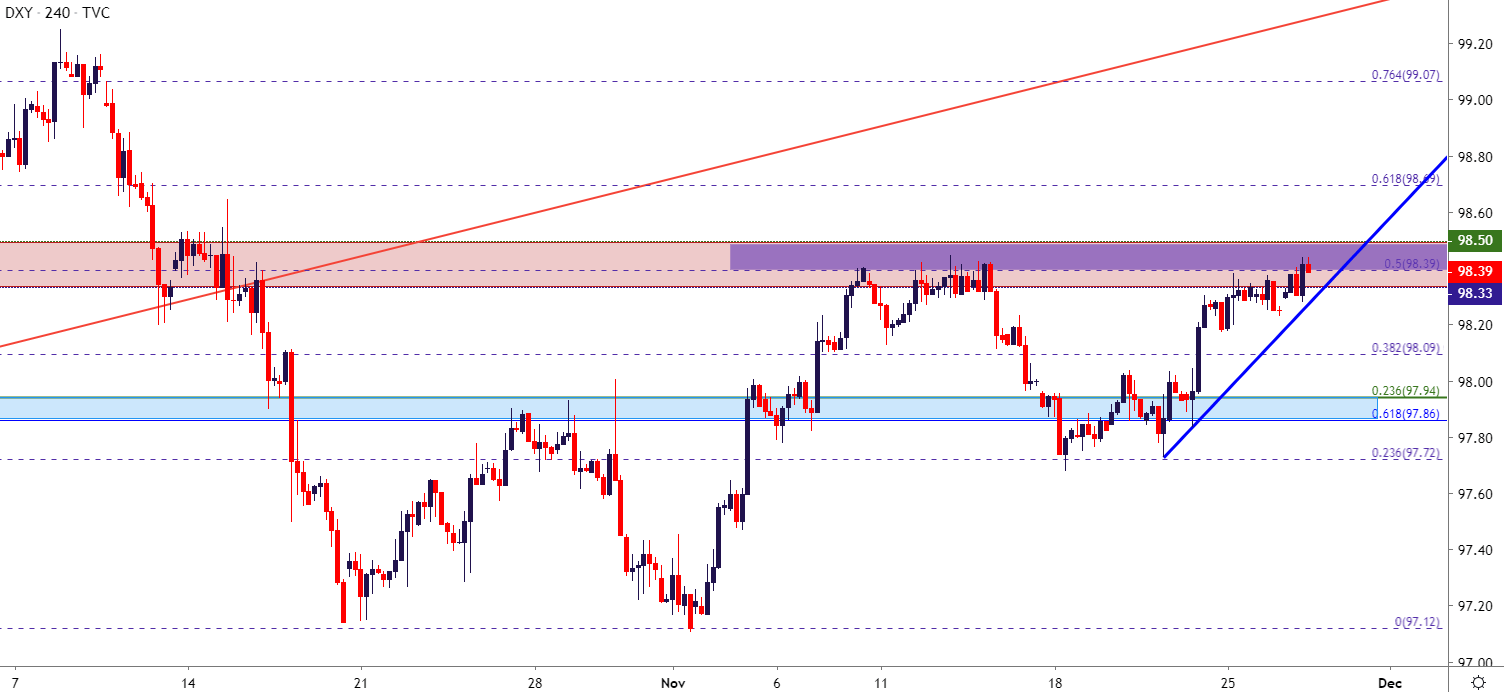
Chart prepared by James Stanley; US Dollar on Tradingview
EUR/USD Holds Support at Key Area on the Chart – but For How Much Longer?
I had looked at this support zone coming into this week and it did help to hold an early-week test in the EUR/USD pair. But, buyers didn’t exactly take control of matters and price action reverted right back to this very key area on the chart, showing in an approximate 17-pip zone from the November swing low of 1.0988 up to the Fibonacci level at 1.1004. As looked at in yesterday’s webinar, bullish swings or short-term bullish reversals seems the most attractive manner of addressing the pair at this point. But, given the persistence from sellers combined with the headline risk on tomorrow morning’s docket, and bearish scenarios should at least be entertained as a possibility.
EUR/USD Four-Hour Price Chart
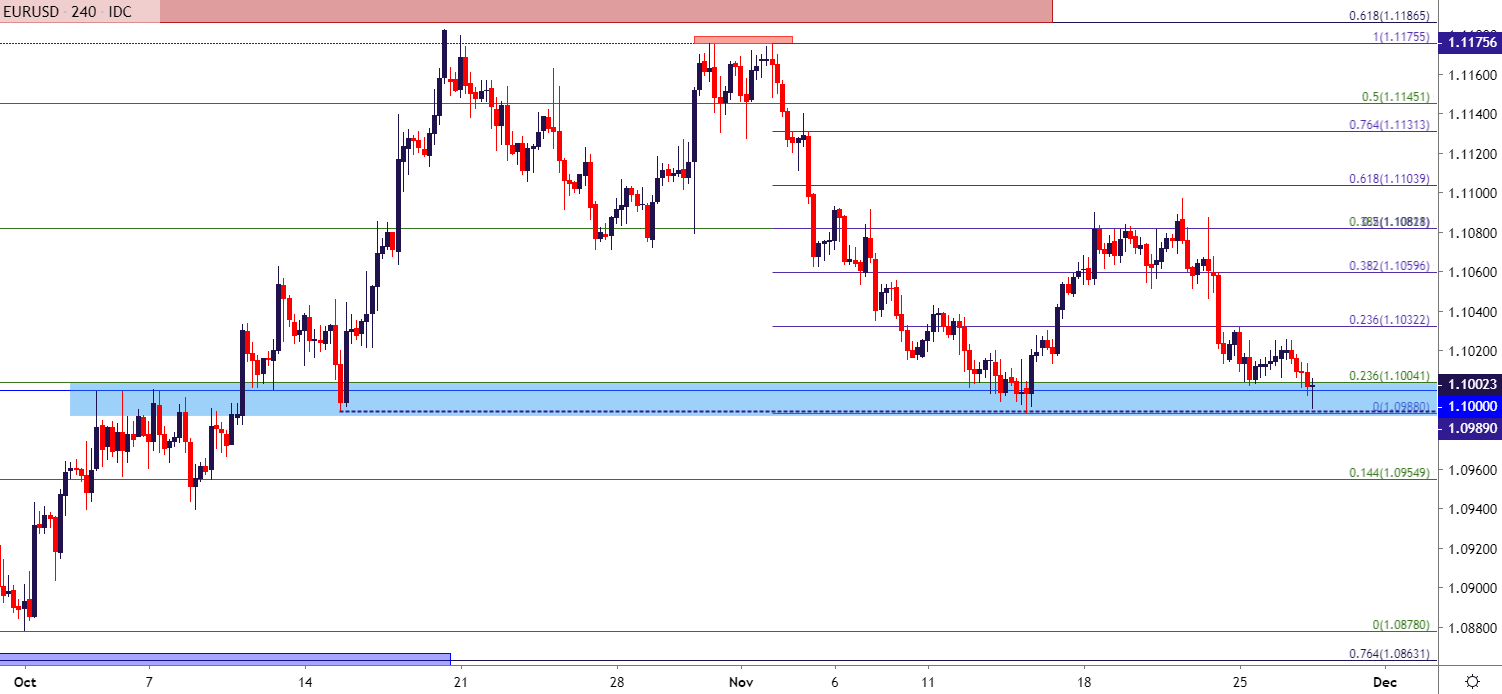
Chart prepared by James Stanley; EURUSD on Tradingview
EUR/USD Breakdown Potential
The potent combo of high-impact data with low-liquidity can spell for fast moves in a market; and given the area of support that’s in-play on the EUR/USD pair right now, and breakdown potential remains going into tomorrow.
But, with that said, proximity from recent swing-highs can make anticipation of that scenario a challenge and, instead, traders can look to address the manner with short-side breakout logic, looking for a push below the November low of 1.0988 to open the door for a re-test of the Fibonacci level at 1.0956. At that point, stops can be adjusted to break-even while further targets are sought on the remainder of the lot, and additional target potential exists around 1.0925, 1.0900 and then the two-year-low currently residing at 1.0878.
EUR/USD Daily Price Chart
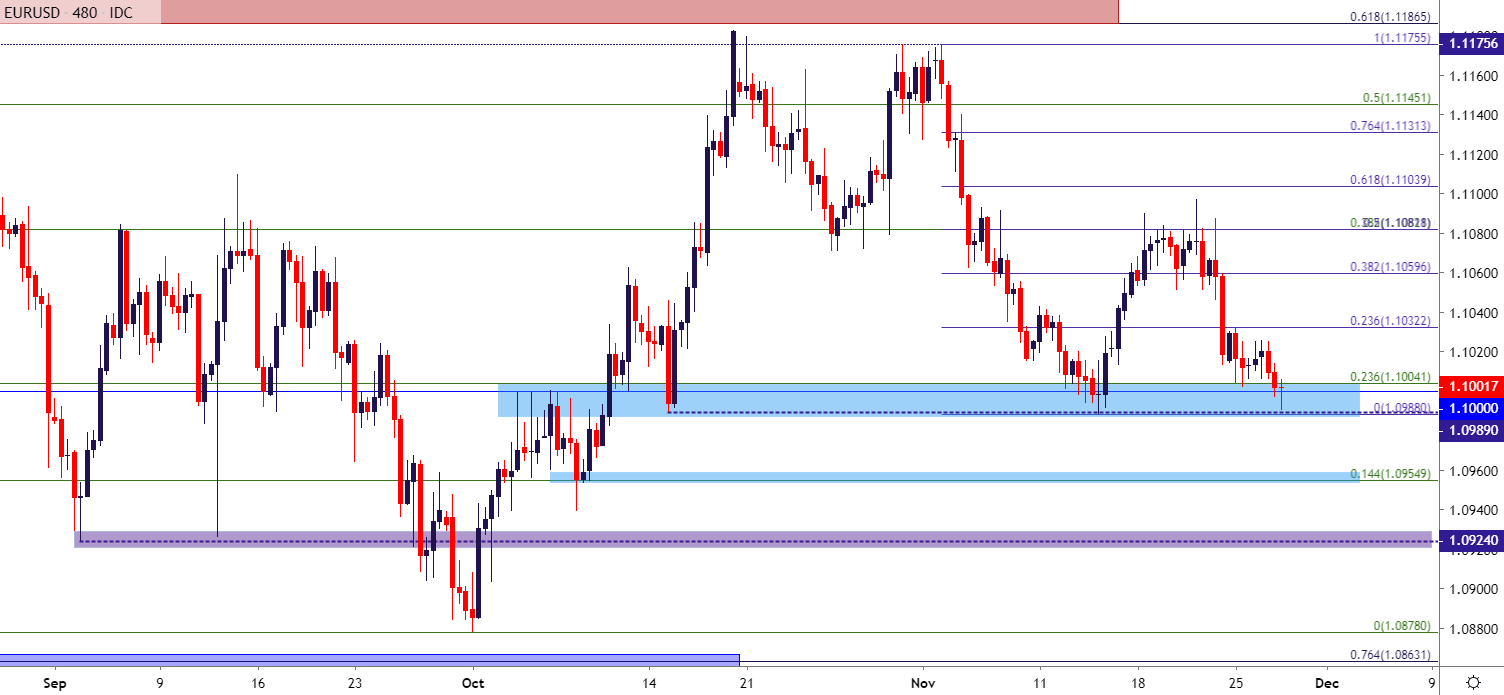
Chart prepared by James Stanley; EURUSD on Tradingview
To read more:
Are you looking for longer-term analysis on the U.S. Dollar? Our DailyFX Forecasts have a section for each major currency, and we also offer a plethora of resources on Gold or USD-pairs such as EUR/USD, GBP/USD, USD/JPY, AUD/USD. Traders can also stay up with near-term positioning via our IG Client Sentiment Indicator.
Forex Trading Resources
DailyFX offers an abundance of tools, indicators and resources to help traders. For those looking for trading ideas, our IG Client Sentiment shows the positioning of retail traders with actual live trades and positions. Our trading guides bring our DailyFX Quarterly Forecasts and our Top Trading Opportunities; and our real-time news feed has intra-day interactions from the DailyFX team. And if you’re looking for real-time analysis, our DailyFX Webinars offer numerous sessions each week in which you can see how and why we’re looking at what we’re looking at.
If you’re looking for educational information, our New to FX guide is there to help new(er) traders while our Traits of Successful Traders research is built to help sharpen the skill set by focusing on risk and trade management.
--- Written by James Stanley, Strategist for DailyFX.com
Contact and follow James on Twitter: @JStanleyFX


