Markets
$69 Trillion of World Debt in One Infographic
Get this infographic as a poster (and save 15% by being a VC+ member)


$69 Trillion of World Debt in One Infographic
Two decades ago, total government debt was estimated to sit at $20 trillion.
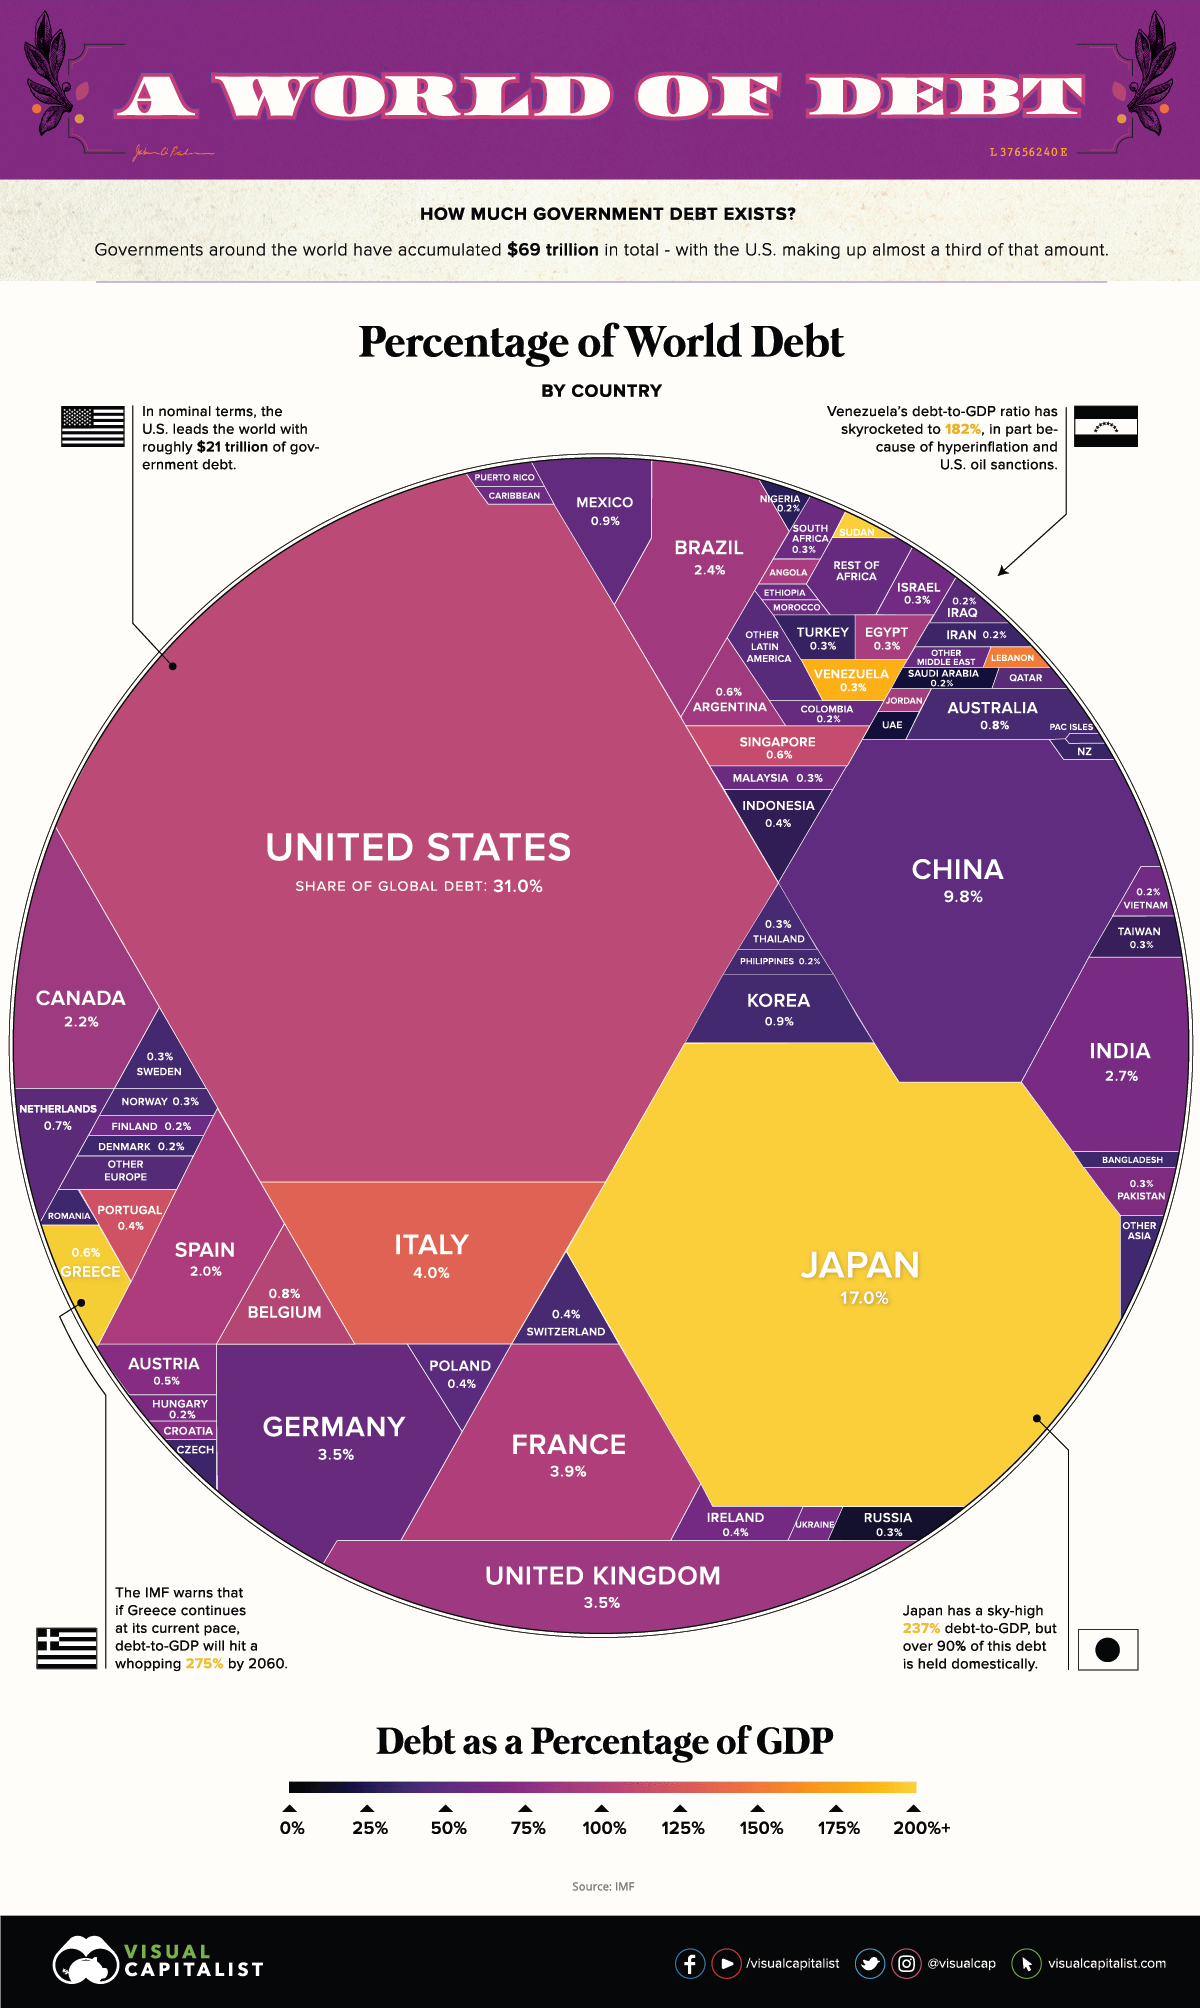
Since then, according to the latest figures by the IMF, the number has ballooned to $69.3 trillion with a debt to GDP ratio of 82% — the highest totals in human history.
Which countries owe the most money, and how do these figures compare?
The Regional Breakdown
Let’s start by looking at the continental level, to get an idea of how world debt is divided from a geographical perspective:
| Region | Debt to GDP | Gross Debt (Billions of USD) | % of Total World Debt |
|---|---|---|---|
| Asia and Pacific | 79.8% | $24,120 | 34.8% |
| North America | 100.4% | $23,710 | 34.2% |
| Europe | 74.2% | $16,225 | 23.4% |
| South America | 75.0% | $2,699 | 3.9% |
| Africa | 56.9% | $1,313 | 1.9% |
| Other | 37.1% | $1,231 | 1.8% |
| World | 81.8% | $69,298 | 100.0% |
In absolute terms, over 90% of global debt is concentrated in North America, Asia Pacific, and Europe — meanwhile, regions like Africa, South America, and other account for less than 10%.
This is not surprising, since advanced economies hold most of the world’s debt (about 75.4%), while emerging or developing economies hold the rest.
World Debt by Country
Now let’s look at individual countries, according to data released by the IMF in October 2019.
It’s worth mentioning that the following numbers are representative of 2018 data, and that for a tiny subset of countries (i.e. Syria) we used the latest available numbers as an estimate.
| Rank | Country | Debt to GDP | Gross Debt ($B) | % of World Total |
|---|---|---|---|---|
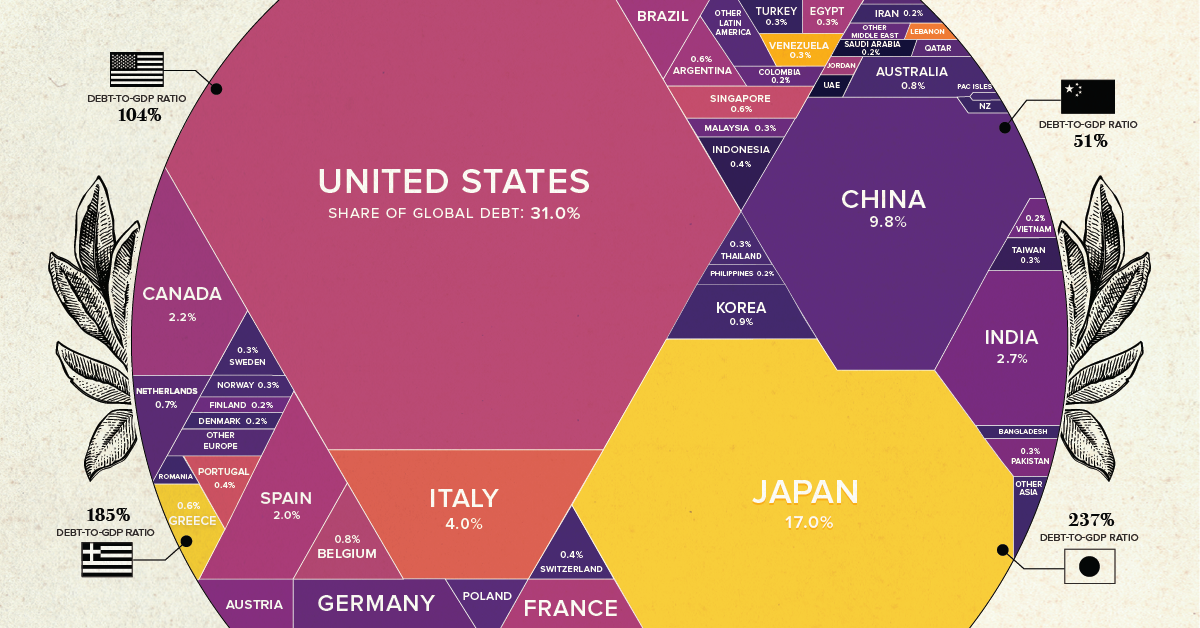
| #1 | 🇺🇸 United States | 104.3% | $21,465 | 31.0% |
| #2 | 🇯🇵 Japan | 237.1% | $11,788 | 17.0% |
| #3 | 🇨🇳 China, People's Republic of | 50.6% | $6,764 | 9.8% |
| #4 | 🇮🇹 Italy | 132.2% | $2,744 | 4.0% |
| #5 | 🇫🇷 France | 98.4% | $2,736 | 3.9% |
| #6 | 🇬🇧 United Kingdom | 86.8% | $2,455 | 3.5% |
| #7 | 🇩🇪 Germany | 61.7% | $2,438 | 3.5% |
| #8 | 🇮🇳 India | 68.1% | $1,851 | 2.7% |
| #9 | 🇧🇷 Brazil | 87.9% | $1,642 | 2.4% |
| #10 | 🇨🇦 Canada | 89.9% | $1,540 | 2.2% |
| #11 | 🇪🇸 Spain | 97.1% | $1,386 | 2.0% |
| #12 | 🇲🇽 Mexico | 53.6% | $655 | 0.9% |
| #13 | 🇰🇷 Korea, Republic of | 37.9% | $652 | 0.9% |
| #14 | 🇦🇺 Australia | 41.4% | $588 | 0.8% |
| #15 | 🇧🇪 Belgium | 102.0% | $543 | 0.8% |
| #16 | Netherlands | 52.4% | $479 | 0.7% |
| #17 | Argentina | 86.1% | $447 | 0.6% |
| #18 | Singapore | 113.6% | $414 | 0.6% |
| #19 | Greece | 184.9% | $404 | 0.6% |
| #20 | Austria | 73.8% | $337 | 0.5% |
| #21 | Indonesia | 30.1% | $308 | 0.4% |
| #22 | Portugal | 120.1% | $289 | 0.4% |
| #23 | Poland | 48.9% | $286 | 0.4% |
| #24 | Switzerland | 40.5% | $286 | 0.4% |
| #25 | Ireland | 63.7% | $244 | 0.4% |
| #26 | Russian Federation | 14.6% | $242 | 0.3% |
| #27 | Turkey | 30.2% | $233 | 0.3% |
| #28 | Egypt | 92.7% | $231 | 0.3% |
| #29 | Pakistan | 71.7% | $226 | 0.3% |
| #30 | Israel | 60.8% | $225 | 0.3% |
| #31 | Sweden | 38.5% | $214 | 0.3% |
| #32 | Thailand | 42.1% | $213 | 0.3% |
| #33 | South Africa | 56.7% | $209 | 0.3% |
| #34 | Taiwan Province of China | 35.1% | $207 | 0.3% |
| #35 | Malaysia | 55.6% | $199 | 0.3% |
| #36 | Venezuela | 182.4% | $180 | 0.3% |
| #37 | Norway | 40.0% | $174 | 0.3% |
| #38 | Colombia | 52.2% | $173 | 0.2% |
| #39 | Finland | 59.3% | $163 | 0.2% |
| #40 | Saudi Arabia | 19.0% | $149 | 0.2% |
| #41 | Iran | 32.2% | $144 | 0.2% |
| #42 | Vietnam | 55.6% | $134 | 0.2% |
| #43 | Philippines | 38.9% | $129 | 0.2% |
| #44 | Denmark | 34.3% | $121 | 0.2% |
| #45 | Hungary | 70.8% | $114 | 0.2% |
| #46 | Iraq | 49.3% | $111 | 0.2% |
| #47 | Nigeria | 27.3% | $109 | 0.2% |
| #48 | Bangladesh | 34.0% | $98.1 | 0.14% |
| #49 | Angola | 89.0% | $94.3 | 0.14% |
| #50 | Qatar | 48.6% | $93.0 | 0.13% |
| #51 | Romania | 36.7% | $87.9 | 0.13% |
| #52 | Lebanon | 151.0% | $85.1 | 0.12% |
| #53 | Czech Republic | 32.6% | $79.9 | 0.12% |
| #54 | United Arab Emirates | 19.1% | $79.1 | 0.11% |
| #55 | Ukraine | 60.2% | $78.8 | 0.11% |
| #56 | Morocco | 65.0% | $77.0 | 0.11% |
| #57 | Chile | 25.6% | $76.3 | 0.11% |
| #58 | Sri Lanka | 83.3% | $74.1 | 0.11% |
| #59 | Sudan | 212.1% | $72.7 | 0.10% |
| #60 | Algeria | 38.3% | $66.5 | 0.10% |
| #61 | New Zealand | 29.8% | $60.5 | 0.09% |
| #62 | Peru | 26.1% | $58.8 | 0.08% |
| #63 | Puerto Rico | 55.5% | $56.1 | 0.08% |
| #64 | Kenya | 60.1% | $52.8 | 0.08% |
| #65 | Slovak Republic | 48.9% | $52.1 | 0.08% |
| #66 | Ecuador | 45.8% | $49.6 | 0.07% |
| #67 | Ethiopia | 61.0% | $49.0 | 0.07% |
| #68 | Croatia | 74.6% | $45.4 | 0.07% |
| #69 | Dominican Republic | 50.5% | $43.2 | 0.06% |
| #70 | Oman | 53.4% | $42.3 | 0.06% |
| #71 | Jordan | 94.4% | $39.9 | 0.06% |
| #72 | Ghana | 59.3% | $38.9 | 0.06% |
| #73 | Slovenia | 70.4% | $38.1 | 0.05% |
| #74 | Uruguay | 63.5% | $37.9 | 0.05% |
| #75 | Kazakhstan | 21.0% | $36.3 | 0.05% |
| #76 | Bahrain | 94.7% | $35.7 | 0.05% |
| #77 | Costa Rica | 53.5% | $32.3 | 0.05% |
| #78 | Tunisia | 77.0% | $30.7 | 0.04% |
| #79 | Belarus | 47.8% | $28.5 | 0.04% |
| #80 | Serbia | 54.5% | $27.5 | 0.04% |
| #81 | Myanmar | 38.2% | $26.2 | 0.04% |
| #82 | Panama | 39.5% | $25.7 | 0.04% |
| #83 | Cyprus | 102.5% | $25.1 | 0.04% |
| #84 | Côte d'Ivoire | 53.2% | $22.9 | 0.03% |
| #85 | Bolivia | 53.8% | $21.8 | 0.03% |
| #86 | Tanzania | 37.3% | $21.2 | 0.03% |
| #87 | Zambia | 78.1% | $20.9 | 0.03% |
| #88 | Kuwait | 14.7% | $20.8 | 0.03% |
| #89 | Guatemala | 24.7% | $19.4 | 0.03% |
| #90 | Lithuania | 34.2% | $18.2 | 0.03% |
| #91 | Syria | 30.0% | $18.0 | 0.03% |
| #92 | Yemen | 64.8% | $17.9 | 0.03% |
| #93 | El Salvador | 67.1% | $17.5 | 0.03% |
| #94 | Cameroon | 39.1% | $15.1 | 0.02% |
| #95 | Luxembourg | 21.4% | $14.9 | 0.02% |
| #96 | Jamaica | 94.4% | $14.6 | 0.02% |
| #97 | Senegal | 61.6% | $14.5 | 0.02% |
| #98 | Mozambique | 99.8% | $14.4 | 0.02% |
| #99 | Bulgaria | 20.4% | $13.3 | 0.02% |
| #100 | Latvia | 35.9% | $12.5 | 0.02% |
| #101 | Turkmenistan | 29.1% | $11.9 | 0.02% |
| #102 | Uganda | 41.4% | $11.6 | 0.02% |
| #103 | Albania | 69.9% | $10.5 | 0.02% |
| #104 | Uzbekistan | 20.6% | $10.4 | 0.02% |
| #105 | Lao P.D.R. | 57.2% | $10.4 | 0.01% |
| #106 | Gabon | 60.7% | $10.2 | 0.01% |
| #107 | Congo, Republic of | 87.8% | $10.2 | 0.01% |
| #108 | Trinidad and Tobago | 45.1% | $10.2 | 0.01% |
| #109 | Iceland | 37.6% | $9.8 | 0.01% |
| #110 | Honduras | 40.2% | $9.6 | 0.01% |
| #111 | Mauritius | 66.2% | $9.4 | 0.01% |
| #112 | Paraguay | 21.5% | $9.0 | 0.01% |
| #113 | Azerbaijan | 18.8% | $8.8 | 0.01% |
| #114 | Nepal | 30.2% | $8.8 | 0.01% |
| #115 | Papua New Guinea | 35.5% | $8.2 | 0.01% |
| #116 | Bahamas, The | 63.3% | $7.9 | 0.01% |
| #117 | Zimbabwe | 37.1% | $7.8 | 0.01% |
| #118 | Georgia | 44.9% | $7.3 | 0.01% |
| #119 | Congo, Dem. Rep. of the | 15.3% | $7.2 | 0.01% |
| #120 | Cambodia | 28.6% | $7.0 | 0.01% |
| #121 | Bosnia and Herzegovina | 34.3% | $6.9 | 0.01% |
| #122 | Namibia | 45.8% | $6.6 | 0.01% |
| #123 | Malta | 45.2% | $6.6 | 0.01% |
| #124 | Mali | 37.3% | $6.4 | 0.01% |
| #125 | Barbados | 125.7% | $6.4 | 0.01% |
| #126 | Armenia | 51.3% | $6.4 | 0.01% |
| #127 | Burkina Faso | 42.9% | $6.1 | 0.01% |
| #128 | Equatorial Guinea | 43.3% | $5.9 | 0.01% |
| #129 | Benin | 41.0% | $5.9 | 0.01% |
| #130 | Madagascar | 45.7% | $5.5 | 0.01% |
| #131 | Chad | 48.3% | $5.3 | 0.01% |
| #132 | North Macedonia | 40.5% | $5.1 | 0.01% |
| #133 | Niger | 53.8% | $5.0 | 0.01% |
| #134 | Nicaragua | 37.2% | $4.9 | 0.01% |
| #135 | Guinea | 38.2% | $4.6 | 0.01% |
| #136 | Kyrgyz Republic | 56.0% | $4.5 | 0.01% |
| #137 | Mauritania | 82.9% | $4.3 | 0.01% |
| #138 | Malawi | 62.9% | $4.3 | 0.01% |
| #139 | Togo | 76.2% | $4.1 | 0.01% |
| #140 | Montenegro | 72.6% | $4.0 | 0.01% |
| #141 | Rwanda | 40.7% | $3.9 | 0.01% |
| #142 | Maldives | 68.0% | $3.6 | 0.01% |
| #143 | Tajikistan | 47.9% | $3.6 | 0.01% |
| #144 | Eritrea | 174.3% | $3.5 | 0.01% |
| #145 | Moldova | 29.7% | $3.4 | 0.00% |
| #146 | Haiti | 33.3% | $3.2 | 0.00% |
| #147 | Bhutan | 102.4% | $2.6 | 0.00% |
| #148 | Sierra Leone | 63.0% | $2.6 | 0.00% |
| #149 | Estonia | 8.3% | $2.6 | 0.00% |
| #150 | Fiji | 46.2% | $2.6 | 0.00% |
| #151 | Suriname | 72.8% | $2.5 | 0.00% |
| #152 | Cabo Verde | 124.5% | $2.5 | 0.00% |
| #153 | Aruba | 84.5% | $2.4 | 0.00% |
| #154 | Botswana | 12.1% | $2.3 | 0.00% |
| #155 | Guyana | 52.9% | $2.1 | 0.00% |
| #156 | Burundi | 58.4% | $2.0 | 0.00% |
| #157 | South Sudan, Republic of | 42.2% | $1.9 | 0.00% |
| #158 | Belize | 95.2% | $1.8 | 0.00% |
| #159 | Eswatini | 35.2% | $1.7 | 0.00% |
| #160 | Antigua and Barbuda | 89.5% | $1.4 | 0.00% |
| #161 | Gambia, The | 86.6% | $1.4 | 0.00% |
| #162 | Djibouti | 48.0% | $1.4 | 0.00% |
| #163 | Afghanistan | 6.9% | $1.4 | 0.00% |
| #164 | Kosovo | 17.0% | $1.4 | 0.00% |
| #165 | Liberia | 39.9% | $1.3 | 0.00% |
| #166 | San Marino | 77.9% | $1.3 | 0.00% |
| #167 | Saint Lucia | 64.3% | $1.2 | 0.00% |
| #168 | Lesotho | 44.5% | $1.2 | 0.00% |
| #169 | Central African Republic | 49.9% | $1.1 | 0.00% |
| #170 | Guinea-Bissau | 64.3% | $0.9 | 0.00% |
| #171 | Seychelles | 56.9% | $0.9 | 0.00% |
| #172 | Grenada | 63.5% | $0.8 | 0.00% |
| #173 | Saint Vincent and the Grenadines | 74.5% | $0.6 | 0.00% |
| #174 | Saint Kitts and Nevis | 60.5% | $0.6 | 0.00% |
| #175 | Vanuatu | 51.4% | $0.5 | 0.00% |
| #176 | Samoa | 50.3% | $0.4 | 0.00% |
| #177 | Dominica | 74.1% | $0.4 | 0.00% |
| #178 | Hong Kong SAR | 0.1% | $0.4 | 0.00% |
| #179 | Brunei Darussalam | 2.6% | $0.4 | 0.00% |
| #180 | São Tomé and Príncipe | 74.5% | $0.3 | 0.00% |
| #181 | Comoros | 21.0% | $0.2 | 0.00% |
| #182 | Timor-Leste | 6.1% | $0.2 | 0.00% |
| #183 | Solomon Islands | 9.4% | $0.1 | 0.00% |
| #184 | Micronesia, Fed. States of | 20.3% | $0.1 | 0.00% |
| #185 | Nauru | 58.3% | $0.1 | 0.00% |
| #186 | Marshall Islands | 25.2% | $0.1 | 0.00% |
| #187 | Kiribati | 20.6% | $0.0 | 0.00% |
| #188 | Tuvalu | 28.1% | $0.0 | 0.00% |
In absolute terms, the most indebted nation is the United States, which has a gross debt of $21.5 trillion according to the IMF as of 2018.
If you’re looking for a more precise figure for 2019, the U.S. government’s “Debt to the Penny” dataset puts the amount owing to exactly $23,015,089,744,090.63 as of November 12, 2019.
Of course, the U.S. is also the world’s largest economy in nominal terms, putting the debt to GDP ratio at 104.3%
Other stand outs from the list above include Japan, which has the highest debt to GDP ratio (237.1%), and China , which has increased government debt by almost $2 trillion in just the last two years. Meanwhile, the European economies of Italy and Belgium check the box as other large debtors with ratios topping 100% debt to GDP.


Markets
Mapped: Europe’s GDP Per Capita, by Country
Which European economies are richest on a GDP per capita basis? This map shows the results for 44 countries across the continent.


Mapped: Europe’s GDP Per Capita, by Country (2024)
This was originally posted on our Voronoi app. Download the app for free on iOS or Android and discover incredible data-driven charts from a variety of trusted sources.
Europe is home to some of the largest and most sophisticated economies in the world. But how do countries in the region compare with each other on a per capita productivity basis?
In this map, we show Europe’s GDP per capita levels across 44 nations in current U.S. dollars. Data for this visualization and article is sourced from the International Monetary Fund (IMF) via their DataMapper tool, updated April 2024.
Europe’s Richest and Poorest Nations, By GDP Per Capita
Luxembourg, Ireland, and Switzerland, lead the list of Europe’s richest nations by GDP per capita, all above $100,000.
| Rank | Country | GDP Per Capita (2024) |
|---|---|---|
| 1 | 🇱🇺 Luxembourg | $131,380 |
| 2 | 🇮🇪 Ireland | $106,060 |
| 3 | 🇨🇭 Switzerland | $105,670 |
| 4 | 🇳🇴 Norway | $94,660 |
| 5 | 🇮🇸 Iceland | $84,590 |
| 6 | 🇩🇰 Denmark | $68,900 |
| 7 | 🇳🇱 Netherlands | $63,750 |
| 8 | 🇸🇲 San Marino | $59,410 |
| 9 | 🇦🇹 Austria | $59,230 |
| 10 | 🇸🇪 Sweden | $58,530 |
| 11 | 🇧🇪 Belgium | $55,540 |
| 12 | 🇫🇮 Finland | $55,130 |
| 13 | 🇩🇪 Germany | $54,290 |
| 14 | 🇬🇧 UK | $51,070 |
| 15 | 🇫🇷 France | $47,360 |
| 16 | 🇦🇩 Andorra | $44,900 |
| 17 | 🇲🇹 Malta | $41,740 |
| 18 | 🇮🇹 Italy | $39,580 |
| 19 | 🇨🇾 Cyprus | $37,150 |
| 20 | 🇪🇸 Spain | $34,050 |
| 21 | 🇸🇮 Slovenia | $34,030 |
| 22 | 🇪🇪 Estonia | $31,850 |
| 23 | 🇨🇿 Czech Republic | $29,800 |
| 24 | 🇵🇹 Portugal | $28,970 |
| 25 | 🇱🇹 Lithuania | $28,410 |
| 26 | 🇸🇰 Slovakia | $25,930 |
| 27 | 🇱🇻 Latvia | $24,190 |
| 28 | 🇬🇷 Greece | $23,970 |
| 29 | 🇭🇺 Hungary | $23,320 |
| 30 | 🇵🇱 Poland | $23,010 |
| 31 | 🇭🇷 Croatia | $22,970 |
| 32 | 🇷🇴 Romania | $19,530 |
| 33 | 🇧🇬 Bulgaria | $16,940 |
| 34 | 🇷🇺 Russia | $14,390 |
| 35 | 🇹🇷 Türkiye | $12,760 |
| 36 | 🇲🇪 Montenegro | $12,650 |
| 37 | 🇷🇸 Serbia | $12,380 |
| 38 | 🇦🇱 Albania | $8,920 |
| 39 | 🇧🇦 Bosnia & Herzegovina | $8,420 |
| 40 | 🇲🇰 North Macedonia | $7,690 |
| 41 | 🇧🇾 Belarus | $7,560 |
| 42 | 🇲🇩 Moldova | $7,490 |
| 43 | 🇽🇰 Kosovo | $6,390 |
| 44 | 🇺🇦 Ukraine | $5,660 |
| N/A | 🇪🇺 EU Average | $44,200 |
Note: Figures are rounded.
Three Nordic countries (Norway, Iceland, Denmark) also place highly, between $70,000-90,000. Other Nordic peers, Sweden and Finland rank just outside the top 10, between $55,000-60,000.
Meanwhile, Europe’s biggest economies in absolute terms, Germany, UK, and France, rank closer to the middle of the top 20, with GDP per capitas around $50,000.
Finally, at the end of the scale, Eastern Europe as a whole tends to have much lower per capita GDPs. In that group, Ukraine ranks last, at $5,660.
A Closer Look at Ukraine
For a broader comparison, Ukraine’s per capita GDP is similar to Iran ($5,310), El Salvador ($5,540), and Guatemala ($5,680).
According to experts, Ukraine’s economy has historically underperformed to expectations. After the fall of the Berlin Wall, the economy contracted for five straight years. Its transition to a Western, liberalized economic structure was overshadowed by widespread corruption, a limited taxpool, and few revenue sources.
Politically, its transformation from authoritarian regime to civil democracy has proved difficult, especially when it comes to institution building.
Finally, after the 2022 invasion of the country, Ukraine’s GDP contracted by 30% in a single year—the largest loss since independence. Large scale emigration—to the tune of six million refugees—is also playing a role.
Despite these challenges, the country’s economic growth has somewhat stabilized while fighting continues.

-

 Markets5 days ago
The World’s Fastest Growing Emerging Markets (2024-2029 Forecast)
-

 Technology2 weeks ago
All of the Grants Given by the U.S. CHIPS Act
-

 Green2 weeks ago
The Carbon Footprint of Major Travel Methods
-

 United States2 weeks ago
Visualizing the Most Common Pets in the U.S.
-

 Culture2 weeks ago
The World’s Top Media Franchises by All-Time Revenue
-

 Visual Capitalist1 week ago
Best Visualizations of April on the Voronoi App
-

 Wealth1 week ago
Charted: Which Country Has the Most Billionaires in 2024?
-

 Markets1 week ago
The Top Private Equity Firms by Country