Markets
Mapped: The World’s Largest Exporters in 2018
Visualizing the World’s Largest Exporters in 2018
Trillions of dollars of goods get traded around the world every year.
In 2018, total global exports exceeded $19 trillion, including specialized goods falling into almost every possible category imaginable.
Whether you’re talking about German cars, Bangladeshi t-shirts, Saudi oil, or Swiss milk chocolate, just about anything is available on the world market for a price – and the world’s largest exporting countries aim to take advantage.
Ranked: The 15 Largest Exporters in 2018
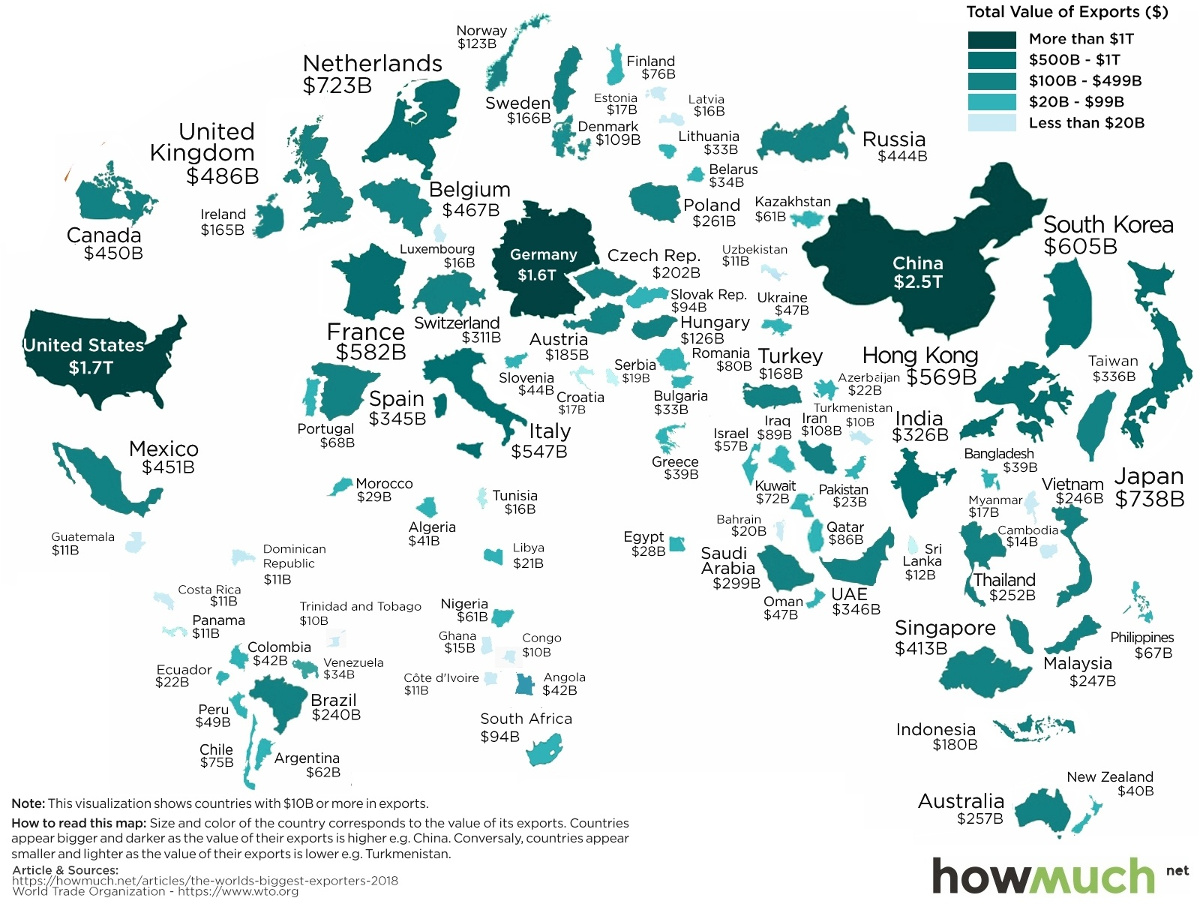
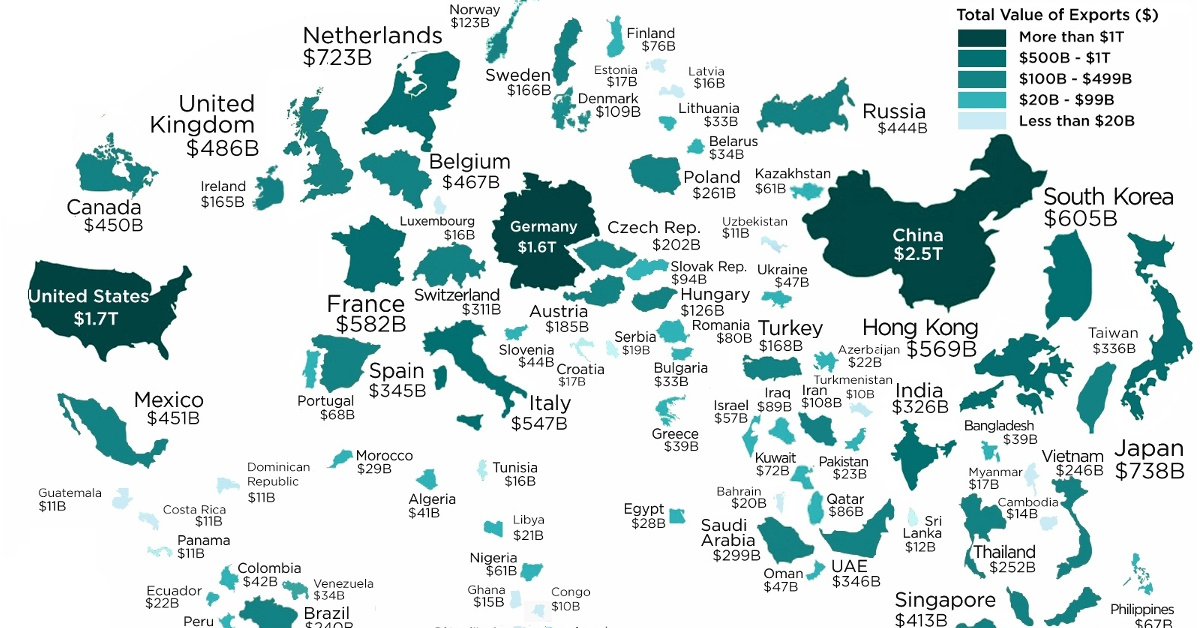
Today’s visualization comes to us from HowMuch.net, and it resizes countries based on their most recent export numbers, as per data from the World Trade Organization (WTO).
Let’s take a look at how the field breaks down:
| Rank | Country | Exports (2018, $M) | Share of Global Total |
|---|---|---|---|
| #1 | 🇨🇳 China | $2,487,045 | 12.8% |
| #2 | 🇺🇸 United States | $1,664,085 | 8.6% |
| #3 | 🇩🇪 Germany | $1,560,816 | 8.0% |
| #4 | 🇯🇵 Japan | $738,403 | 3.8% |
| #5 | 🇳🇱 Netherlands | $722,668 | 3.7% |
| #6 | 🇰🇷 Korea, Rep. | $604,860 | 3.1% |
| #7 | 🇫🇷 France | $581,816 | 3.0% |
| #8 | 🇭🇰 Hong Kong, China | $569,241 | 2.9% |
| #9 | 🇮🇹 Italy | $546,643 | 2.8% |
| #10 | 🇬🇧 United Kingdom | $485,711 | 2.5% |
| #11 | 🇧🇪 Belgium | $466,724 | 2.4% |
| #12 | 🇲🇽 Mexico | $450,572 | 2.3% |
| #13 | 🇨🇦 Canada | $449,845 | 2.3% |
| #14 | 🇷🇺 Russia | $444,008 | 2.3% |
| #15 | 🇸🇬 Singapore | $412,629 | 2.1% |
Leading the list of the world’s largest exporters is China, with a whopping $2.5 trillion of goods sent abroad in 2018. If you add in Hong Kong’s numbers, China holds 15.7% of the global export total — roughly equal to Japan, Netherlands, South Korea, France, and Singapore combined.
Coming next on the list is the U.S., which exports about $1.7 trillion of goods each year. After that comes Germany, which is the only other country to export over $1 trillion of goods per year.
Comparing U.S. and Chinese Exports
What does China export, and how does that compare to a more developed economy such as the United States?
Using data from MIT’s Observatory of Economic Complexity, we can see the broad breakdown of exports in both countries:
| 🇨🇳 China (Exports) | Share | 🇺🇸 U.S. (Exports) | Share | |
|---|---|---|---|---|
| Machines | 48.5% | Machines | 22.1% | |
| Textiles | 9.9% | Transportation | 14.9% | |
| Metals | 7.1% | Chemical Products | 13.7% | |
| Chemical Products | 4.9% | Mineral Products | 11.4% | |
| Plastics and Rubbers | 4.0% | Instruments | 6.8% | |
| Instruments | 3.2% | Plastics and Rubbers | 5.5% | |
| Transportation | 3.2% | Vegetable Products | 5.1% | |
| Footwear and Headwear | 2.6% | Metals | 4.8% | |
| Stone and Glass | 1.7% | Foodstuffs | 3.3% | |
| Mineral Products | 1.3% | Precious Metals | 3.1% | |
| Animal Hides | 1.2% | Animal Products | 2.2% | |
| Other/Misc | 12.4% | Paper Goods | 2.1% | |
| Textiles | 1.7% | |||
| Other/Misc | 3.3% |
On first glance, it’s clear that China’s exports are reliant on one heavy-hitting category (Machines) to drive a whopping 48.5% of total export value. Within that broad category of machines, there are many narrower categories, including:
- Broadcasting equipment (9.6% of total exports)
- Computers (6.1%)
- Office machine parts (3.8%)
- Integrated circuits (3.3%)
- Telephones (2.6%)
- Electrical transformers (1.3%)
- Semiconductor devices (1.2%)
- Video displays (1.1%)
For the United States, machines are still important at 22.1% of exports, but three other broad categories also surpass the 10% mark: transportation, chemical products, and mineral products. This means the U.S. is generally more diversified in its major exports.
For more, see the largest export of each state on this map.


Markets
Visualizing Global Inflation Forecasts (2024-2026)
Here are IMF forecasts for global inflation rates up to 2026, highlighting a slow descent of price pressures amid resilient global growth.


Visualizing Global Inflation Forecasts (2024-2026)
Global inflation rates are gradually descending, but progress has been slow.
Today, the big question is if inflation will decline far enough to trigger easing monetary policy. So far, the Federal Reserve has held rates for nine months amid stronger than expected core inflation, which excludes volatile energy and food prices.
Yet looking further ahead, inflation forecasts from the International Monetary Fund (IMF) suggest that inflation will decline as price pressures ease, but the path of disinflation is not without its unknown risks.
This graphic shows global inflation forecasts, based on data from the April 2024 IMF World Economic Outlook.
Get the Key Insights of the IMF’s World Economic Outlook
Want a visual breakdown of the insights from the IMF’s 2024 World Economic Outlook report?
This visual is part of a special dispatch of the key takeaways exclusively for VC+ members.
Get the full dispatch of charts by signing up to VC+.
The IMF’s Inflation Outlook
Below, we show the IMF’s latest projections for global inflation rates through to 2026:
| Year | Global Inflation Rate (%) | Advanced Economies Inflation Rate (%) | Emerging Market and Developing Economies Inflation Rate (%) |
|---|---|---|---|
| 2019 | 3.5 | 1.4 | 5.1 |
| 2020 | 3.2 | 0.7 | 5.2 |
| 2021 | 4.7 | 3.1 | 5.9 |
| 2022 | 8.7 | 7.3 | 9.8 |
| 2023 | 6.8 | 4.6 | 8.3 |
| 2024 | 5.9 | 2.6 | 8.3 |
| 2025 | 4.5 | 2.0 | 6.2 |
| 2026 | 3.7 | 2.0 | 4.9 |
After hitting a peak of 8.7% in 2022, global inflation is projected to fall to 5.9% in 2024, reflecting promising inflation trends amid resilient global growth.
While inflation has largely declined due to falling energy and goods prices, persistently high services inflation poses challenges to mitigating price pressures. In addition, the IMF highlights the potential risk of an escalating conflict in the Middle East, which could lead to energy price shocks and higher shipping costs.
These developments could negatively affect inflation scenarios and prompt central banks to adopt tighter monetary policies. Overall, by 2026, global inflation is anticipated to decline to 3.7%—still notably above the 2% target set by several major economies.
Adding to this, we can see divergences in the path of inflation between advanced and emerging economies. While affluent nations are forecast to see inflation edge closer to the 2% target by 2026, emerging economies are projected to have inflation rates reach 4.9%—falling closer to their pre-pandemic averages.
Get the Full Analysis of the IMF’s Outlook on VC+
This visual is part of an exclusive special dispatch for VC+ members which breaks down the key takeaways from the IMF’s 2024 World Economic Outlook.
For the full set of charts and analysis, sign up for VC+.

-

 United States6 days ago
Visualizing the Most Common Pets in the U.S.
-

 Culture2 weeks ago
The Highest Earning Athletes in Seven Professional Sports
-

 Science2 weeks ago
Visualizing the Average Lifespans of Mammals
-

 Brands2 weeks ago
How Tech Logos Have Evolved Over Time
-

 Energy2 weeks ago
Ranked: The Top 10 EV Battery Manufacturers in 2023
-

 Countries2 weeks ago
Countries With the Largest Happiness Gains Since 2010
-

 Economy2 weeks ago
VC+: Get Our Key Takeaways From the IMF’s World Economic Outlook
-

 Demographics1 week ago
The Countries That Have Become Sadder Since 2010