Featured
Speculations suggest Fed rate cut still likely
To cut, or not to cut, that is the question. Speculation continues that the Fed is going to cut rates as early as July.
There are signs of a slowing global economy and yields in North America have been falling. We have a look at longer-term cycles to see where we are in the interest rate cycle. And the results are interesting.
Our recession watch spread is widening but others are pointing to another yield curve inversion as more important. We have a look. The stock market is rising and we continue to watch the potential broadening top pattern. Does the market still have room to move higher? Seems so.
Gold is at the “make” or “break” zone and again we have mixed signals with silver lagging but gold stocks leading. Meanwhile, the commercial COT gets shorter but from 2008-2011 the commercials rode their shorts all the way to the top. With the attack in the Gulf, our chart of the week looks at oil.
The FOMC announces its decision around 2 PM Wednesday. The BofC also comes out with its decision this week as well. No change expected.
US sanctions and tariffs
“Weapons of mass disruption.” That was the headline for this week’s The Economist, June 8–14, 2019. The weapons? Tariffs, tech blacklists, financial isolation, sanctions. The Economist illustrated the weapon as a bomb with the words written on the side and Trump’s face on it as it heads to earth. Pretty dramatic. Who has been targeted? Well, just about anybody and everybody.
China, India, the EU, Mexico, Canada, Australia, South Korea, and others have been hit with tariffs or threatened with tariffs at some point in time. Agreements such as the pending United States-Mexico-Canada Agreement (USMCA), replacing the North American Free Trade Agreement, are made and tossed aside at will. One of Trump’s first acts was to pull out of the Trans-Pacific Partnership (TRP), a trade agreement that the U.S. had agreed to join. Companies such as China’s Huawei have been blacklisted, causing supply problems for numerous U.S. semiconductor firms. Sanctions have been placed on a host of countries and individuals in Russia, Venezuela, Iran, Sudan, Cuba, Syria, North Korea, and elsewhere. The U.S. also threatens to cut off any countries or companies dealing with embargoed countries such as Iran.
Sanctions, blacklists, financial isolation, tariffs—they are all just different sides of the same coin. Economic blackmail. And for the U.S., it doesn’t matter whether the target is a friend (allies) or a foe (enemies). They can all fall victim to a Trump tweet. But ultimately, as history has shown, it is a failed strategy and it could result in a global recession or worse (depression and war). Trump thinks he is playing a game of showdown, poker and that the other side will blink and give him what he wants. Instead, he is playing a blind game of dead man’s bluff and no one knows who is holding the best hand.
The USMCA was not all that much different than NAFTA, despite all the bluffs and histrionics from Trump. And because no legislature in Mexico, the U.S., or Canada has actually passed it, NAFTA remains in effect. China has no intention of caving into Trump’s demands. It effectively becomes a game of one-upmanship or “take that” and the reply is “oh, yeah, take that.” Kids in the schoolyard. In the end, both sides get hurt. And the U.S. is beginning to hurt. Farmers, business, consumers are feeling it. But Trump’s supporters are unwavering, even if they are crying “uncle.” They’ll feel it in China as well. But do they fall in line behind the leader? They follow as long as they are not seen to cave to the U.S. China made that mistake in another time. They won’t do it again. Meanwhile, the two continue their dance with warships in the South China Sea.
Our concern is: what is the effect on markets? Since the Trump tariff wars got underway back in January 2018 it is surprising—or maybe not—that nothing has performed particularly well. Our chart below shows that, surprisingly, the iShares Canadian Government Bond Index ETF (XGB/TSX) has led the way with a gain of 8.1%. The 10-year U.S. Treasury note (UST) is up 4.2% before any coupons. The S&P 500 has eked out a small gain of 1.9% while the TSX Composite (TSX) is flat, up 0.2%. The Dow Jones Industrials (INDU) is down 1.1% while gold (GOLD) has lost 1.4%. Bonds have turned out to be the best bet so far.

But will bonds continue to perform? There is actually a pretty good chance that they will, at least in the near term. Our long-term chart of the 30-year U.S. Treasury bond price (USB) is shown below. Raymond Merriman of MMA Cycles has described an 18-year cycle in bonds (range 15–21 years). Bonds made their all-time low in December 1981. Since then bonds have made significant lows in January 2000 (18 years) and more recently in October 2018 (18 years). Those were most likely our 18-year cycle low. As well, Merriman describes the 18-year cycle splitting up into 6-year cycles (range 5–7 years). Important lows were observed in October 1987 (6 years), October 1994 (7 years), January 2000 (6 years), a double bottom low in June 2007 (7 years), a low in December 2013 (6 years), and finally the recent low in October 2018 (5 years). If that is correct, then we have made both our 18- and 6-year cycle lows and bonds should be generally positive for the next few years.
The question is, will bonds spike as they have in the past or will it be a choppy market as was seen between 2000–2007? Or have we seen a long-term cycle low in yield for bonds and the next phase will be a long-term rise in yields (fall in prices)? We note that in most instances the peak for bond prices came generally within a year or so of the cycle low during the long-term rise in prices (fall in yields). The next 6-year cycle low won’t be due until 2023–2025. Certainly, Trump wants lower interest rates and he has once again been attacking Fed Chairman Jerome Powell because of his failure to lower the rates. Trump even mused he wished he was as powerful as Chinese Chairman Xi Jinjiang so that he could order the Fed to do his bidding.
PBOC enjoys a high degree of independence, although it is a department of the State Council of the People’s Republic of China that is headed by the Prime Minister, currently Li Keqiang. In that respect that is not much different than the Bank of Canada (BofC) which is a crown corporation with all of its shares held by the Department of Finance. Surprisingly, the board of governors of PBOC is not a lot different than the Fed or the BofC. Like the Fed, they have regional branches and go even deeper with municipal sub-branches and county sub-branches.

While there has recently been some speculation that the Fed would lower interest rates, the likelihood is low with unemployment at a multi-decade low. The latest job numbers are giving pause and coupled with downward revisions in previous months many are noting this as a reason for the Fed to cut now. The Fed has expressed concern about the trade wars and will continue to monitor the situation. With the FOMC meeting this week, watch carefully the wording. If they drop the word “patient” some are interpreting that as there is a Fed cut in the offing.
If there is a problem with bonds, it is that the world has been slowly moving away from the U.S. dollar and from U.S. bonds. Foreign holdings of U.S. securities are relatively flat over the past year (up $200 billion) even as the U.S. debt has climbed to $22.4 trillion, up roughly $900 billion in the past year. Could the trade wars escalate to the point where China threatens the nuclear option to sell its vast holdings of U.S. treasuries? Many doubt it, nor does it make sense for China or the market. But what if in the escalating trade war, the U.S. banned Chinese shares trading in New York. Or cut off Chinese banks as The Economist article suggested. There is roughly $1 trillion in Chinese shares trading on the NYSE. A financial panic would follow. And then China might press the nuclear option of selling their $1-trillion holdings of U.S.Treasuries.
Interest rates have been generally falling (yields move inverse to price) since 1981, a period of 38 years. That’s a long time. Historically it’s unprecedented. Data on U.S. Treasuries goes back to 1791 when the first debt was issued by the U.S. Yields generally fell from 1791 to 1824 (33 years), rose again, and then generally fell again from 1861 to 1889 (28 years). Rates rose again, peaking in April 1920. Then another historical decline got underway. While the bottom was in November 1941 (21 years), interest rates generally did not really start to rise until a low in February 1954 (34 years from the 1920 peak). Rates peaked in September 1981 before another long decline got underway.

We have no way of knowing how this trade war with China will play out. But 38 years of falling interest rates is a historically long time and interest rates may be overdue to start rising again. Because we most likely just made the 18-year cycle low, the odds don’t favor rates to start rising immediately. But this is something to think about and watch. We will know that the cycle has shifted into long-term bear market rates if the highs in yield seen in November 2018 are taken out (lows in prices).
If the U.S. bond market was to enter a long-term bear market, then the “elephant in the room” comes to the forefront. The elephant-corporate debt. As of Q4 2018 total debt securities for non-financial corporations in the U.S. exceeds $6.2 trillion. Add in debt securities to financial corporations and that is another $22 trillion. Much of the corporate debt outstanding is one downgrade from junk status. Non-financial corporate debt-to-GDP has now exceeded previous levels seen prior to the recessions of 1990-1992, 2000-2002 and 2007-2009.

We are, most likely, still early in this trade war. However, with seemingly no resolution or a mental “winner take all” attitude by the U.S., the odds of this going completely off the rails at some point increases. It is not as if a trade war is cheap. The Fed estimates that Trump’s initial round of tariffs has cost U.S. households each $414. A second round of tariffs is estimated to cost each household $831. Tariffs are like an additional tax. That said, there are many who believe both sides will come to their senses and find a deal that keeps everyone happy. Trump has put Xi on the spot with his demand for a meeting at the G20 summit on June 28–29. The U.S. has warned China of “consequences” if Xi doesn’t sit with Trump. No arrangements have been made. China does not respond to demands.
However, as we previously noted, this is a different kind of war. China has been challenging U.S. global hegemony and the U.S. cannot or will not allow that to happen. Nobody wins in trade wars. They have a way of taking on a life of their own that can end disastrously for all.
Markets and trends

We don’t wish to put too much hope in what appears to be a broadening top formation on the S&P 500 as a broadening top pattern in technical analysis is rare. Volume expanded on the bear moves (waves B and D) and diminished on the up moves (waves C and E). Volume was also diminishing on the move to the January 2018 top (wave A). While the pattern is rare, this one also appears to be classic, making three successive moves to higher highs. Or, as we call it, sometimes three moves to higher highs than lights out. It is also known as a 5-point reversal pattern.
The pattern usually completes itself when it reaches the top of the channel once again (wave E). That level is currently near 3,000. It confirms itself when it breaks down and busts under the most recent low, currently near 2,700. While rare, the pattern usually appears at significant tops. As to the potential downside once the pattern is complete, well, the bottom of the channel is down near 2,200. The potential ultimate target could be down to 1,500. As we noted, the pattern is rare and we haven’t seen this mentioned anywhere else. That the Dow Jones Industrials (DJI) and others are not making new highs along with the S&P 500 is not an issue as divergences are not unusual at major tops.

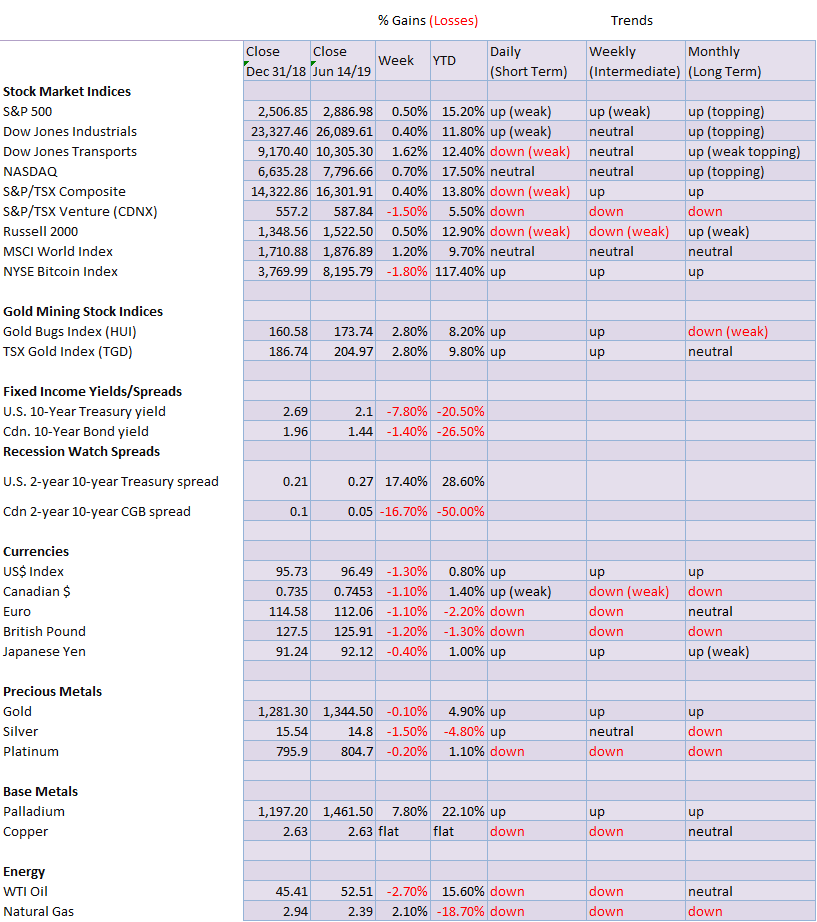
Despite a setback in the latter part of the week, the S&P 500 managed another up week, gaining 0.5%. The Dow Jones Industrials (DJI) was up 0.4% while the Dow Jones Transportations (DJT) gained 1.6%. The heavy tech-laden NASDAQ was up 0.7% while the small-cap Russell 2000 gained 0.5%. Elsewhere, the TSX Composite was up 0.4% but the small-cap TSX Venture Exchange (CDNX) lost 1.5%. Overseas, the London FTSE 100 gained 0.3% despite all the background political turmoil, the Paris CAC 40 was up about 0.1% and the German DAX jumped 0.4%. In Asia, China’s Shanghai Index (SSEC) gained 1.9% despite all the trade turmoil while Tokyo’s Nikkei Dow (TKN) was up 1.1%. Hard to believe but Hong Kong’s Hang Seng Index was up 0.6% against the background of the turmoil, although that did seem to be resolving itself by week’s end as the government backed off a little bit.
It is tricky trying to discern where we are in this particular cycle. We believe the final top was seen last September–October and that the action since then has been the start of a potential bear market. The collapse into December 2018 was the A wave down. We continue to trace out the B wave up. It is not unusual for B waves like this to see new highs. It acts as a hook for the market, suggesting that the bull is alive and well. The B wave appears to be complete. If complete, we are now embarking on the C wave that could take us to 3,000. That would complete the (B) wave of a higher degree.
The FOMC next week might help determine if the stock market can move higher. Hints that the Fed might cut would be positive for the market as would hints that the U.S. and China are going to talk trade again.

These are divergences we just can’t ignore. The S&P 500 has started to climb again and currently is only 2% off its recent highs. On the other hand, the KBW Bank Index (BKX) has been in a downtrend since January 2018 and is 18% off from those highs. The Semiconductor Index (SOX), laden with the tech giants and suffering the backlash of the U.S./China trade war, is off 15.5% from its recent highs. The SOX fell 1.6% this past week even as the S&P 500 was up on the week. Banks and the high-tech industry are two key components in the market. And if they can’t go up even as the broader index is going up there is a problem here. Both the BKX and the SOX are signaling that a potentially more serious bear market could soon be upon us.

The NYSE advance-decline line has soared to new highs this past week even as the S&P 500 remains below its recent highs. The advance-decline continues to suggest that higher prices are ahead and that the S&P 500 could once again see new highs. We don’t disagree. But we do note some other indicators, such as the McClellan Summation Index (RASI), are now indicating that the market could be topping. The Put Call ratio also continues to favor call options over puts, so it remains somewhat optimistic. For the time being, we’ll go with the advance-decline line that appears to suggest higher prices ahead.

Bonds, as represented here by the 10-year U.S. Treasury note, remain in their upcycle (down in yield as yields move inversely to price). It is possible that the 10-year is trading along the bottom of its current range, so any further declines in yield will be more labored. A rebound to the top of the channel is not out of the question. That level is currently at 2.35%. The cry for rate cuts by the Fed continues, but some think that the Fed might only do one this year and not until December. The Fed meeting is next week, June 18–19. Some are noting that if the word “patient” is dropped from the Fed language it might imply a rate cut in July. We doubt it. Trade concerns aside and slowing economic numbers still do not warrant a rate cut. Oddly, Fed fund futures are pointing to at least an 80% chance of a rate cut in July. Only 20% for a June cut. The Fed usually follows a path of rate cuts on the quarter—i.e., March, June, September, December—suggesting to us at least that the earliest for a rate cut is in September if nothing happens next week as suspected.
Recession watch spread

Our closely watched 2-year U.S. Treasury note—10-year U.S. Treasury note spread is nowhere near negative. Indeed, at 25 bp it is as wide as it has been over the past six months. Given some other spreads are negative, we do wonder whether this particular spread is misleading and that it is wide because of what is going on with the 2-year U.S. Treasury note. The 2-year U.S. Treasury note is more impacted by what the Fed does with short-term rates. And with speculation growing that the Fed is about to cut rates, the 2-year is falling in yield faster than the 10-year, thus widening the spread. Something to consider.

Many, instead, are pointing to the 3-month U.S. Treasury bill–10-year U.S. Treasury note as better reflecting the current environment and acting as a predictor of a recession. The 3m–10y spread has been negative now since mid-May. We do note that in the last recession the 3m–10y spread went negative in July 2006, a good year before the recession actually hit. It peaked—or is it bottomed—in February 2007, still more than a few months before the official start of the recession. So, one does have to be careful about how one interprets these things. They are an early warning system. But the spread could remain negative for a number of months before a recession actually hits. Does this mean the stock market is about to hit the skids? Not necessarily. In 1998 and in 2006 after the 3m–10y spread turned negative, the stock market continued to rise for a number of months. However, in 2001 when the same thing happened the stock market fell. So, it depends.

Here we have overlaid the 3m–10y spread (red) on the 2y–10y spread (black). As one can see, the 2y–10y spread went negative a good 5–6 months before the 3m–10y spread inverted in 2000. In 2006, the two went negative almost together. And so far, this time the 3m–10y is negative but not the 2y–10y. Different times, different results. As a predictor, it’s up in the air.

The German 10-year Bund has spiraled into negative interest rates. This is interesting considering Germany is not actually in a recession. Is the 10-year Bund predicting a recession? Hard to say. In 2016 the 10-year Bund went negative as well but no recession happened.

We chose the iShares Canadian Government Bond Index ETF (XGB-TSX) as a substitute for the Canadian bond market. Since November the XGD has been on a tear, up over 9%. These are Canadian government bonds we are talking about, not speculative penny mining stocks or even a blue-chip stock. The XGD has proven to be a strong performer. The best part is the XGD is still not showing any signs of a top, although we note volume is fading as we move higher. It is probably late in the cycle here. A breakdown under $22 would suggest a top is in. As to yield? Well the XGD yields only a paltry 0.67%.

We are not sure whether President Trump’s babblings that it doesn’t matter whether he meets with Xi at the June 28–29 G20 summit or not that sparked a rally in the U.S. dollar yesterday. But the U.S. dollar jumped and gold fell after. The U.S. dollar might have also been helped by decent retail sales numbers and benign inflation. And despite the background babble concerning a Fed rate cut the U.S. dollar still went up. The US$ Index gained 0.6% this past week while the euro fell 1.1%. The pound sterling also fell 1.1% while the Japanese yen was off 0.4%. The Canadian dollar was hit as well, falling 1.1%. The US$ Index continues to bounce off of the support of the 200-day MA and 165-day EMA.
Resistance is seen at the 50-day MA, but a move over 97.25 could spark a further US$ Index rally towards 98. The high to date remains at 98.26, well short of our targets of 101.60. As long as those key MAs hold and the uptrend line holds just above 96, then the bias is for the US$ Index is to continue to move higher. The uptrend line has been in place since September 2018, so it does seem to be acting as solid support. A break below 96 could prove fatal for the US$ Index. The Fed meeting next week could help determine the near term for the U.S. dollar. Any sign that the Fed is contemplating rate cuts would be negative for the U.S. dollar. High rates in the U.S. relative to other countries are helping to keep the U.S. dollar up.

Wither gold? With the entire world—small traders, large traders, banks, central banks—focused on the big breakout zone for gold above $1,370, it is any wonder that we have arrived at the “make” or “break” zone for gold. Are the bulls poised to celebrate? Or are the bears poised to pounce and destroy the gold bulls once again? Friday didn’t help with the U.S. dollar reversing a down move and moving higher and gold of course falling after seeing a new high for the current move at $1,362. The bulls can wince. It now looks like a daily reversal on the charts, which means gold could fall on Monday. But Tuesday brings us the FOMC and we’ll find out by Wednesday the Fed’s plans as to whether they might cut rates or not. Any thought of a rate cut would help gold. Any thought of two rate cuts later this year and gold will sparkle. Three cuts and it will go ballistic. But hold on.
Gold actually fell on the week losing 0.1% following the reversal. Silver, on the other hand, continues to lag (badly) and fell on the week by 1.5%. Platinum was down 0.2% but palladium rose 7.8%. But that’s because Russia controls a good chunk of palladium supplies and is the world’s largest producer. Norilsk, the giant Russian mining company, is the world’s largest producing company. The U.S. is currently in numerous spats with Russia including sanctions.
So, is the cup and handle pattern valid? Well, it has yet to be proven wrong. We are currently in the perfect fail zone for gold. We need to break out over $1,370 and close over that level at least twice, preferably three times, to confirm a breakout. Gold’s RSI is high, but then it can remain high even over 70 for some time before it turns down. If the cup and handle are valid, then gold should break out over $1,370. The pattern invalidates itself under $1,267, the recent low. A break now under $1,324 would suggest that we would next test down to $1,300. The cup and handle, if valid, does project up to at least $1,435 with higher targets as well. If the decline to $1,267 was our E wave it was a pretty shallow one and fell short of desired targets down to $1,235-$1,250. We await the FOMC next week.

The commercial COT for gold fell to 29% this past week from 30% the previous week. Long open interest rose roughly 5,000 contracts while short open interest jumped 34,500 contracts. The commercial COT is now weaker than was seen at the high in February. It suggests a potential fall for gold prices. However, we have seen the commercial COT even lower before gold actually fell. A reminder that during the 2008–2011 bull market for gold the short position for the commercial COT started rising after gold crossed $1,000. It kept rising for the next three years until gold topped in September 2011 over $1,900. That suggests that a rising gold price and a rising short position for the commercial COT are not incompatible. Could it happen again? The large speculators COT (hedge funds, managed futures, etc.) had a big jump to 79% from 74%. Long open interest leaped about 10,000 contracts while short open interest fell a sharp nearly 20,000 contracts.

If there is an argument that gold prices could falter once again it is the poor performance of silver, the poor man’s gold. Normally we would expect silver to lead gold higher. Not this time. Silver has been a laggard. Silver continues to languish below its key MAs, stalling so far at the 165-day EMA, and below the 100-day MA. Support seems to be provided by the 200-day MA. We thought we were breaking out of a descending wedge triangle that suggested a move back up to $16.20 at least. So far, that hasn’t happened. Unlike gold, silver never became overbought on this up move. RSI has stayed well under 70. However, we do note that volume has picked up but hasn’t fully translated into higher prices. There is currently good support for silver down to $14.60, but below that level, silver could fall further towards the $14.27 low of May 28. Only a firm breakout now over $15.20 would suggest higher prices for silver.

The commercial COT for silver slid to 44% this past week from 47% this past week. Long open interest rose over 3,000 contracts while short open interest jumped over 16,000 contracts. The silver commercial COT is still somewhat bullish. We’d want to see levels below 30% to suggest that the silver COT was becoming bearish. Note it was at those levels back in February 2019 when silver made a high. The large speculators COT rose to 51% from 47%. That is not particularly bullish for the large speculators COT.

The TSX Gold Index (TGD) jumped to new highs for the current move this past week, gaining 2.8%. That was interesting against the backdrop of both gold and silver down on the week. The Gold Bugs Index (HUI) rose by 2.8% as well. The TGD is somewhat overbought with RSI over 70, but in a strong move, the RSI can stay over 70 for some time. Could the gold stocks be leading? They have had a good move since the recent low and have flipped themselves around from negative to positive on the year in the process. In a strong bull market, the gold stocks tend to lead. Many individual stocks are also making new highs; however, just as many are still lagging but making interesting bottom patterns. Given new highs above 204.78, the March 2019 high the TGD does suggest a move to at least 232 and the February 2017 high. A break back below 195 would be negative and suggest further declines towards 180–188 support.

After sliding into the depression zone in late May, the Gold Miners Bullish % Index (BPGDM) is now in a happier space. At 52, it is roughly halfway between absolute elation and absolute depression. The index has space to move higher. But we also note over the past few years it has also failed in this zone before. The Gold Miners New Highs–New Lows % Index is also improving but is nowhere near the huge levels, seen at the top in 2wh016. We view this index as encouraging.

The ratio of the TSX Gold Index (TGD) and the TSX Composite remains near its all-time lows. Our records only run back to 2000. However, the ratio is where it was at in the late 1990s and during the 1960s and early 1970s . The peak was seen back in the early 1980s as gold rose to $875. The last peak on this chart was in 2009 long before gold hit its peak over $1,900 in 2011. Nothing stays down forever. We note a higher low in 2018 vs. the low in 2015. Gold stocks are relatively under-owned by funds. It’s a small market and it doesn’t take much of an increase in demand to see the ratio climb as it did in 2016.
Chart of the week

Wither oil prices? An attack on some oil tankers in the Gulf of Oman—which is close to the Straits of Hormuz, where over 30% of the world’s oil is shipped through—sparked a jump in the price of oil on Thursday. Follow-through the next day, however, was anemic. Forecasts for weakened demand in 2019 because of a slowing global economy and a jump in inventories helped dampen the fears of a big jump in oil prices. Saber rattling against Iran followed as they became the fall guys for the attack. The U.S. is sure to ratchet up sanctions against Iran as they try to bring the Iranian economy to its knees. Similar sanctions against Venezuela and Libya have also caused global supply disruptions. While the odds of a real shooting war vs. Iran is purely speculative, we are reminded that Iran holds the fourth largest oil reserves behind Venezuela, Saudi Arabia, and Canada. Iran holds the world’s second largest natural gas reserves behind Russia.
All this led us to look at the big picture for oil to see where we might be in the cycles. Oil prices do appear to be forming a large bear channel with the top of the channel currently around $80 and the bottom of the channel way down below $25. That suggests to us that a firm breakout above $80 could spark a new bull market that could run up towards the old high at $147 seen in 2008. War in the Gulf would do that. But if that doesn’t materialize, then we may be looking at the bottom of the channel.
Oil prices appear to have a cycle of around 9 years between lows, suggesting that there is also an 18-year cycle that corresponds well with other markets. We have labeled possible 9-year cycle lows on the chart above (range would be at least 7–11 years). We note that starting in 1945, oil prices largely adhered to that cycle going forward. Oil prices made an interesting low just after the end of WW2 in 1945. From there the next discernible low was seen in December 1956, roughly 11 years later. That low led to the formation of OPEC in 1960. There was another low on the charts in January 1965, roughly nine years from the 1956 low. OAPEC was formed in 1967 and the 6-day war was also in 1967.
The next important date came in July 1973 as the Arab oil embargo took hold after the Yom Kippur War. That came eight years after 1965. It was then a long stretch to the next major low in April 1986 (1), a period of 13 years. That low came following the Iranian revolution peak in March 1981 and then a monumental collapse as supply surged and the effects of the Iran revolution wore off.
That low seemed out of place with the 9-year cycle, but the next significant low came only seven years later in December 1993 (2). That balanced the previous long cycle as the average was 10 years. The low in December 1998 (3) under $10 also threw the cycle off, coming a mere five years later. But once again things balanced out with the major low in February 2009 (4b) 11 years later, giving the combined range 1993-2009 an average of 8 years. We also noted an important low in January 2007 (4a) which was the last low before the market went from $50 to $147 in a matter of months.
That brings us to our final significant low in February 2016 (5) when oil prices fell to $26. That came seven years after the February 2009 low or nine years following the January 2007 low. If we have entered the up phase of the cycle, the question is: how high will oil prices rise? Will they be contained by the channel currently near $80 or will they break out? A nine-year cycle tends to break down into three phases of three years. So, we might find a low sometime here in 2019. Could that low have been the December 2018 low of $42.36? It is well within the acceptable range.
There is a tussle with oil prices right now, given the potential for war in the Gulf (bullish) or weakening global demand and growing inventories (bearish). One will prevail, but our sense right now is that we are still on the up phase of the current cycle and geopolitical concerns should continue to dominate.
(Featured image by DepositPhotos)
__
DISCLAIMER: David Chapman is not a registered advisory service and is not an exempt market dealer (EMD). We do not and cannot give individualized market advice. The information in this article is intended only for informational and educational purposes. It should not be considered a solicitation of an offer or sale of any security. The reader assumes all risk when trading in securities and David Chapman advises consulting a licensed professional financial advisor before proceeding with any trade or idea presented in this article. We share our ideas and opinions for informational and educational purposes only and expect the reader to perform due diligence before considering a position in any security. That includes consulting with your own licensed professional financial advisor.


![Kevin Harrington - 1.5 Minutes to a Lifetime of Wealth [OTC: RSTN]](https://born2invest.com/wp-content/uploads/2023/12/kevin-harrington-400x240.jpg)
![Kevin Harrington - 1.5 Minutes to a Lifetime of Wealth [OTC: RSTN]](https://born2invest.com/wp-content/uploads/2023/12/kevin-harrington-80x80.jpg)


![RDE, Inc. [ OTC: RSTN ] is set to soar in a perfect storm](https://born2invest.com/wp-content/uploads/2024/02/pexels-burak-the-weekender-187041-400x240.jpg)
![RDE, Inc. [ OTC: RSTN ] is set to soar in a perfect storm](https://born2invest.com/wp-content/uploads/2024/02/pexels-burak-the-weekender-187041-80x80.jpg)


The World’s Largest Insurers Have ESG Blind Spots, According to ShareAction
The evaluation of the 65 insurance companies carried out by ShareAction confirms the need for constant evaluation of the sustainable...


Spending on R&D in Biotechnology Increased by 13% in 2022 and Reached 2.56 Billion
In 2022, spending on biotechnology Research and Development (R&D) increased by 13% to reach 2.56 billion euros. Company expenditure grew...


Consolidation in Sight in the Italian and European Crowdfunding Sector
The trend towards the creation of “super platforms” could materialize well beyond a single isolated case: according to the European...

JuicyFields – the Largest Investment Fraud in the Cannabis Industry
The JuicyFields case is a warning to investors around the world, illustrating the risks associated with attractive but unverified investment...


AI Will Revolutionize Mental Health, Generating 2.5 Billion in Spain
The AI boom extends to mental health, with startups emerging in Spain aiming to leverage technology for patient and professional...
 |
|
 |  |
 |
|
-
 Crypto2 weeks ago
Why the US Government Transferred $2 Billion Worth of Bitcoin
-

 Africa6 days ago
Burkina’s Economy on the Rise in February 2024, Report Shows
-
 Impact Investing1 week ago
A Seed Round Worth Over a Million for Amalia Care
-

 Biotech3 days ago
What Financial Impact Can the Health Sector Expect from the Metaverse Integration