


CNY CURRENCY VOLATILITY – TALKING POINTS
- Elevated USDCNH implied volatility readings persist as forex option traders still anticipate heightened price action in the Chinese Yuan
- CNY could move significantly in response to trade talk headlines and Wednesday’s expected data dump from China
- Find out why you should Watch CNY, HKD & SHCOMP for Clues on US China Trade War
Spot USDCNH prices notched a parabolic ascent since markets caught wind that trade tensions between the US and China were escalating. The shocking deterioration in negotiations stunned market participants and sent traders fleeing from risk and into safe-havens. Likewise, the jolt of uncertainty caused currency market volatility to surge and was notably reflected in USDCNH implied volatility measures.
USDCNH AND IMPLIED VOLATILITY: DAILY TIME FRAME (MAY 14, 2018 TO MAY 14, 2019)
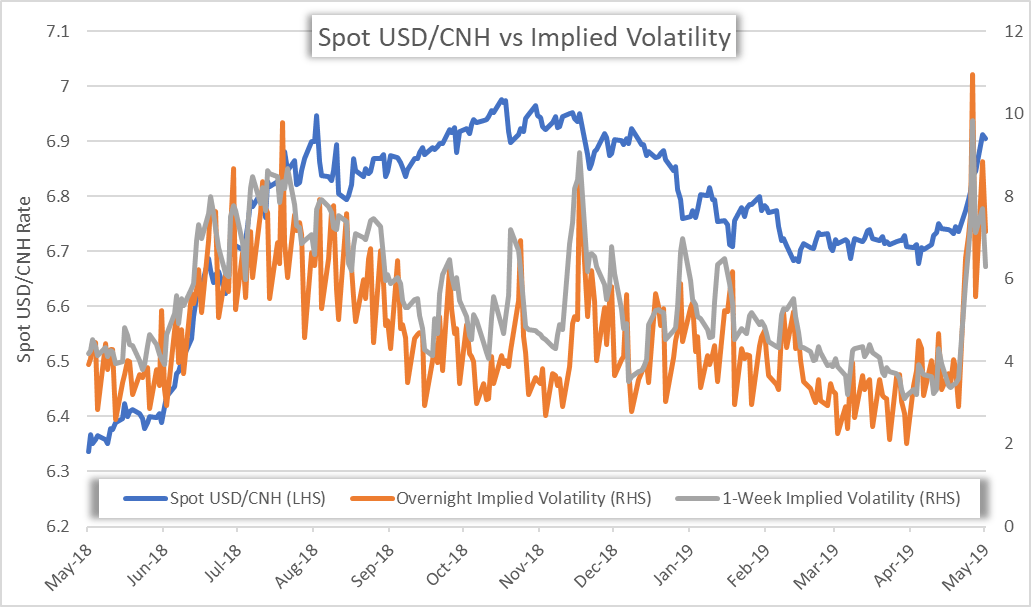
Following President Trump’s tweets on May 3 which stated that the US will increase tariffs on Chinese exports, USDCNH overnight implied volatility skyrocketed from 2.91 percent to 6.51 percent and exploded further to 10.95 percent by May 9 as market risk and uncertainty took footing.
Similar spikes in USDCNH implied volatility have historically seen sizable swings in spot prices follow – generally with fundamental factors such as the US China trade war serving as catalysts for big market moves. Although USDCNH implied volatility has receded slightly from the knee-jerk high printed last week, the price action metric across various tenors remains elevated and could suggest that the US Dollar may continue climbing against the Chinese Yuan.
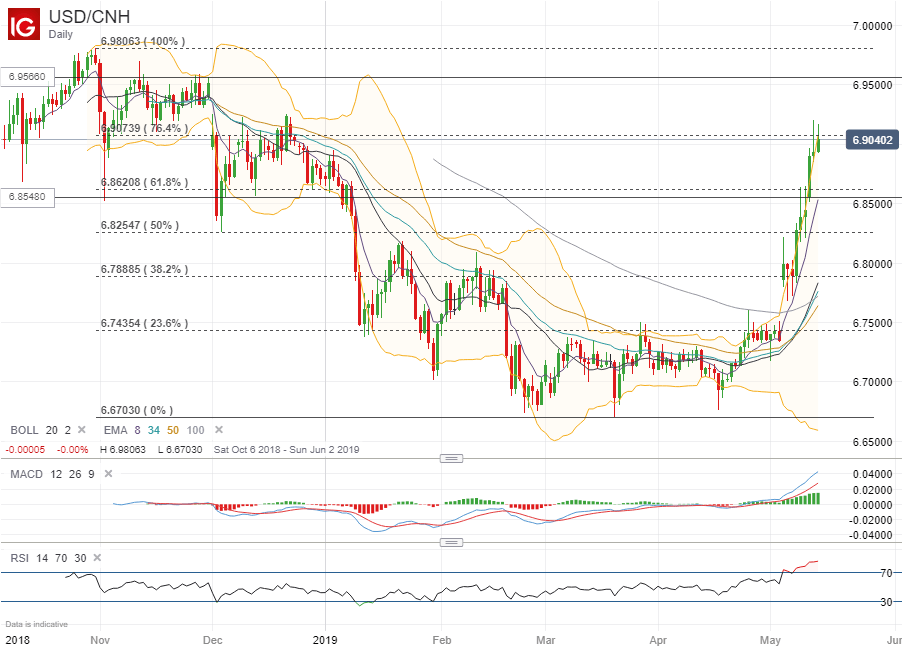
USDCNH PRICE CHART: DAILY TIME FRAME (OCTOBER 7, 2018 TO MAY 14, 2019)
Nevertheless, the next direction of spot USDCNH may be dictated by upcoming Chinese economic data such as industrial production, retail sales, property investment and the jobless rate which are all expected to be released Wednesday at 2:00 GMT.
If tomorrow’s data out of China is reported roughly in line with expectations and does provide any new cause for concern, markets might possibly witness spot USDCNH continue its advance still. This could occur if traders interpret the data with the perspective that the Chinese economy may not have a sense of urgency to land a deal with the US. On the other hand, disappointing data could place added pressure on China to reach a trade agreement which has potential to stymie further gains in USDCNH.
That being said, spot USDCNH is estimated to gyrate between 6.8548 and 6.9566 with a 68 percent statistical probability over the next 5 trading days judging by USDCNH 1-week implied volatility of 6.30 percent. The currency pair currently trades near the 6.9040 mark which is slightly below technical resistance posed by the 76.4 percent Fibonacci retracement level drawn from the respective high and low recorded on October 31, 2018 and March 20, 2019.
As USDCNH approaches the upper or lower bound of the 1-standard deviation band around spot prices, traders might be able to gauge the respective decreasing or increasing likelihood that a US China trade deal will be reached in the near future. Read more about USDCNH and Why 7.00 is the Spot to Watch in the US China Trade War.
- Written by Rich Dvorak, Junior Analyst for DailyFX
- Follow @RichDvorakFX on Twitter


