AUD/USD Technical Strategy: BEARISH
- AUD sellers struggle to sustain momentum after touching 4-month lows
- Positive RSI divergence hints at possible bounce as RBA meeting looms
- Overall positioning continues to carry a bearish bias while sub-0.7147
Get help building confidence in your AUD/USD strategy with our free trading guide!
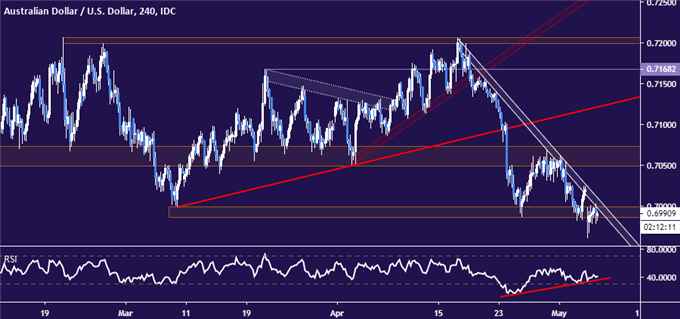
The Australian Dollar turned lower anew after a brief corrective upswing against its US counterpart, as expected. Sellers have struggled to gain ground beyond reversing the relief rally from April lows however. A drop to four-month lows failed to find lasting follow-through, putting prices back within a familiar range just below the 0.70 figure. The proximity of the RBA rate decision may have sapped conviction.
Furthermore, positive RSI divergence hints that ebbing downside momentum may precede a reversal higher. Confirming as much would need a conclusive break above trend line resistance guiding the move lower from the mid-April swing top, now at 0.7009. Pushing beyond that would neutralize immediate selling pressure and put the 0.7049-73 chart inflection area back in focus.

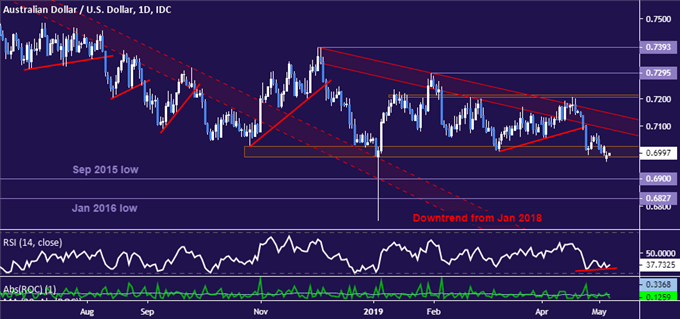
Zooming out to the daily chart, overall positioning still seems to carry bearish implications. AUD/USD price action since the beginning of the year seems to be carving out a descending Triangle pattern, a typically bearish setup whose confirmation would set the stage for resuming the 2018 downtrend. Completing it would require a daily close below support’s outer layer at 0.6982. That would expose the 0.69 figure next.

Invalidating these broader cues would is likely to call for a close above Triangle top resistance, now at 0.7147. Doing so would put AUD/USD back within the congestive range prevailing since late last year. To then establish a convincing bullish bias, prices would need to work their way through several interim resistance barriers and secure a close above the range top at 0.7393.
AUD/USD TRADING RESOURCES
- Just getting started? See our beginners’ guide for FX traders
- Having trouble with your strategy? Here’s the #1 mistake that traders make
- Join a free Trading Q&A webinar and have your questions answered
--- Written by Ilya Spivak, Currency Strategist for DailyFX.com
To contact Ilya, use the comments section below or @IlyaSpivak on Twitter


