


Editor’s note: Since this post was first published, the aggregate credit card utilization rate cited in the second paragraph has been corrected. (May 14, 12:05pm). The percentage of Gen Z credit card users who are “maxed-out” has been corrected in the text and now matches the table. (May 15, 2024, 4:00 pm)

This morning, the New York Fed’s Center for Microeconomic Data released the Quarterly Report on Household Debt and Credit for the first quarter of 2024. Household debt balances grew by $184 billion over the previous quarter, slightly less than the moderate growth seen in the fourth quarter of 2023. Housing debt balances grew by $206 billion. Auto loans saw a $9 billion increase, continuing their steady growth since the second quarter of 2020, while balances on other non-housing debts fell. Credit card balances fell by $14 billion, which is typical for the first quarter. However, an increasing number of borrowers are behind on credit card payments. In this post, we explore the relationship between credit card delinquency and changes in credit card “utilization rates.”
The nationwide aggregate credit card utilization rate—that is, what share of the aggregate credit limit is being used—was about 23 percent last quarter, on par with previous quarters. However, the utilization rates of individuals differ widely: 52 percent of borrowers were using less than 20 percent of their available credit in the first quarter, while 18 percent of borrowers were using at least 90 percent of their available credit (19 percent were between 20 and 60 percent utilization, and 11 percent were between 60 and 90 percent). Here, we focus on the share of borrowers using 90 percent or more of their credit limit, whom we refer to as “maxed-out borrowers,” and how likely they are to miss credit card payments.
Rising Credit Card Delinquencies
For all debt outside of student loans, delinquency has been steadily rising since the fourth quarter of 2021 after historic lows during the COVID-19 pandemic. Credit card delinquencies, in particular, have risen past pre-pandemic levels. Will this trend continue, or are we likely to see a leveling off or even a reduction in credit card delinquencies?
Missed credit card payments are caused by many factors, ranging from forgetfulness to cash flow constraints and income loss. Most of these are difficult to predict or observe in individual-level credit data; however, one observable factor that is strongly correlated with future delinquencies is a high credit card utilization rate. While borrowers who were current on all their cards in the first quarter of 2024 had a median utilization rate of 13 percent in the previous quarter, those who became newly delinquent had a median rate of 90 percent. This makes sense, since using practically all of your available credit could indicate a tight cash-flow situation. Indeed, credit utilization is a key input in credit scores, which are intended to measure the probability of future default.
This strong correlation between utilization and delinquencies indicates that looking at maxed-out borrowers is useful for gaining some insight into where new delinquencies are headed.
The chart below shows the percentage of credit card balances held by current borrowers that is newly transitioning to delinquency, broken down by the borrower’s credit card utilization in the previous quarter. Rates are smoothed as a four-quarter moving sum to avoid seasonality. The two lowest utilization groups have low rates of transition to delinquency throughout the time series (1 percent for the 0-20 percent utilization group and 4 percent for the 20-60 percent group) and are now at their pre-pandemic level. However, the transition rates for those with greater than 60 percent utilization have surpassed pre-pandemic levels and continue to rise, accounting for most of the increases in overall credit card delinquency rates. This increase is especially remarkable for the 90-100 percent utilization group; about a third of balances associated with maxed-out borrowers have gone delinquent in the last year, compared to less than a quarter of balances per year before the pandemic.
Maxed-Out Borrowers See Increasing Delinquency
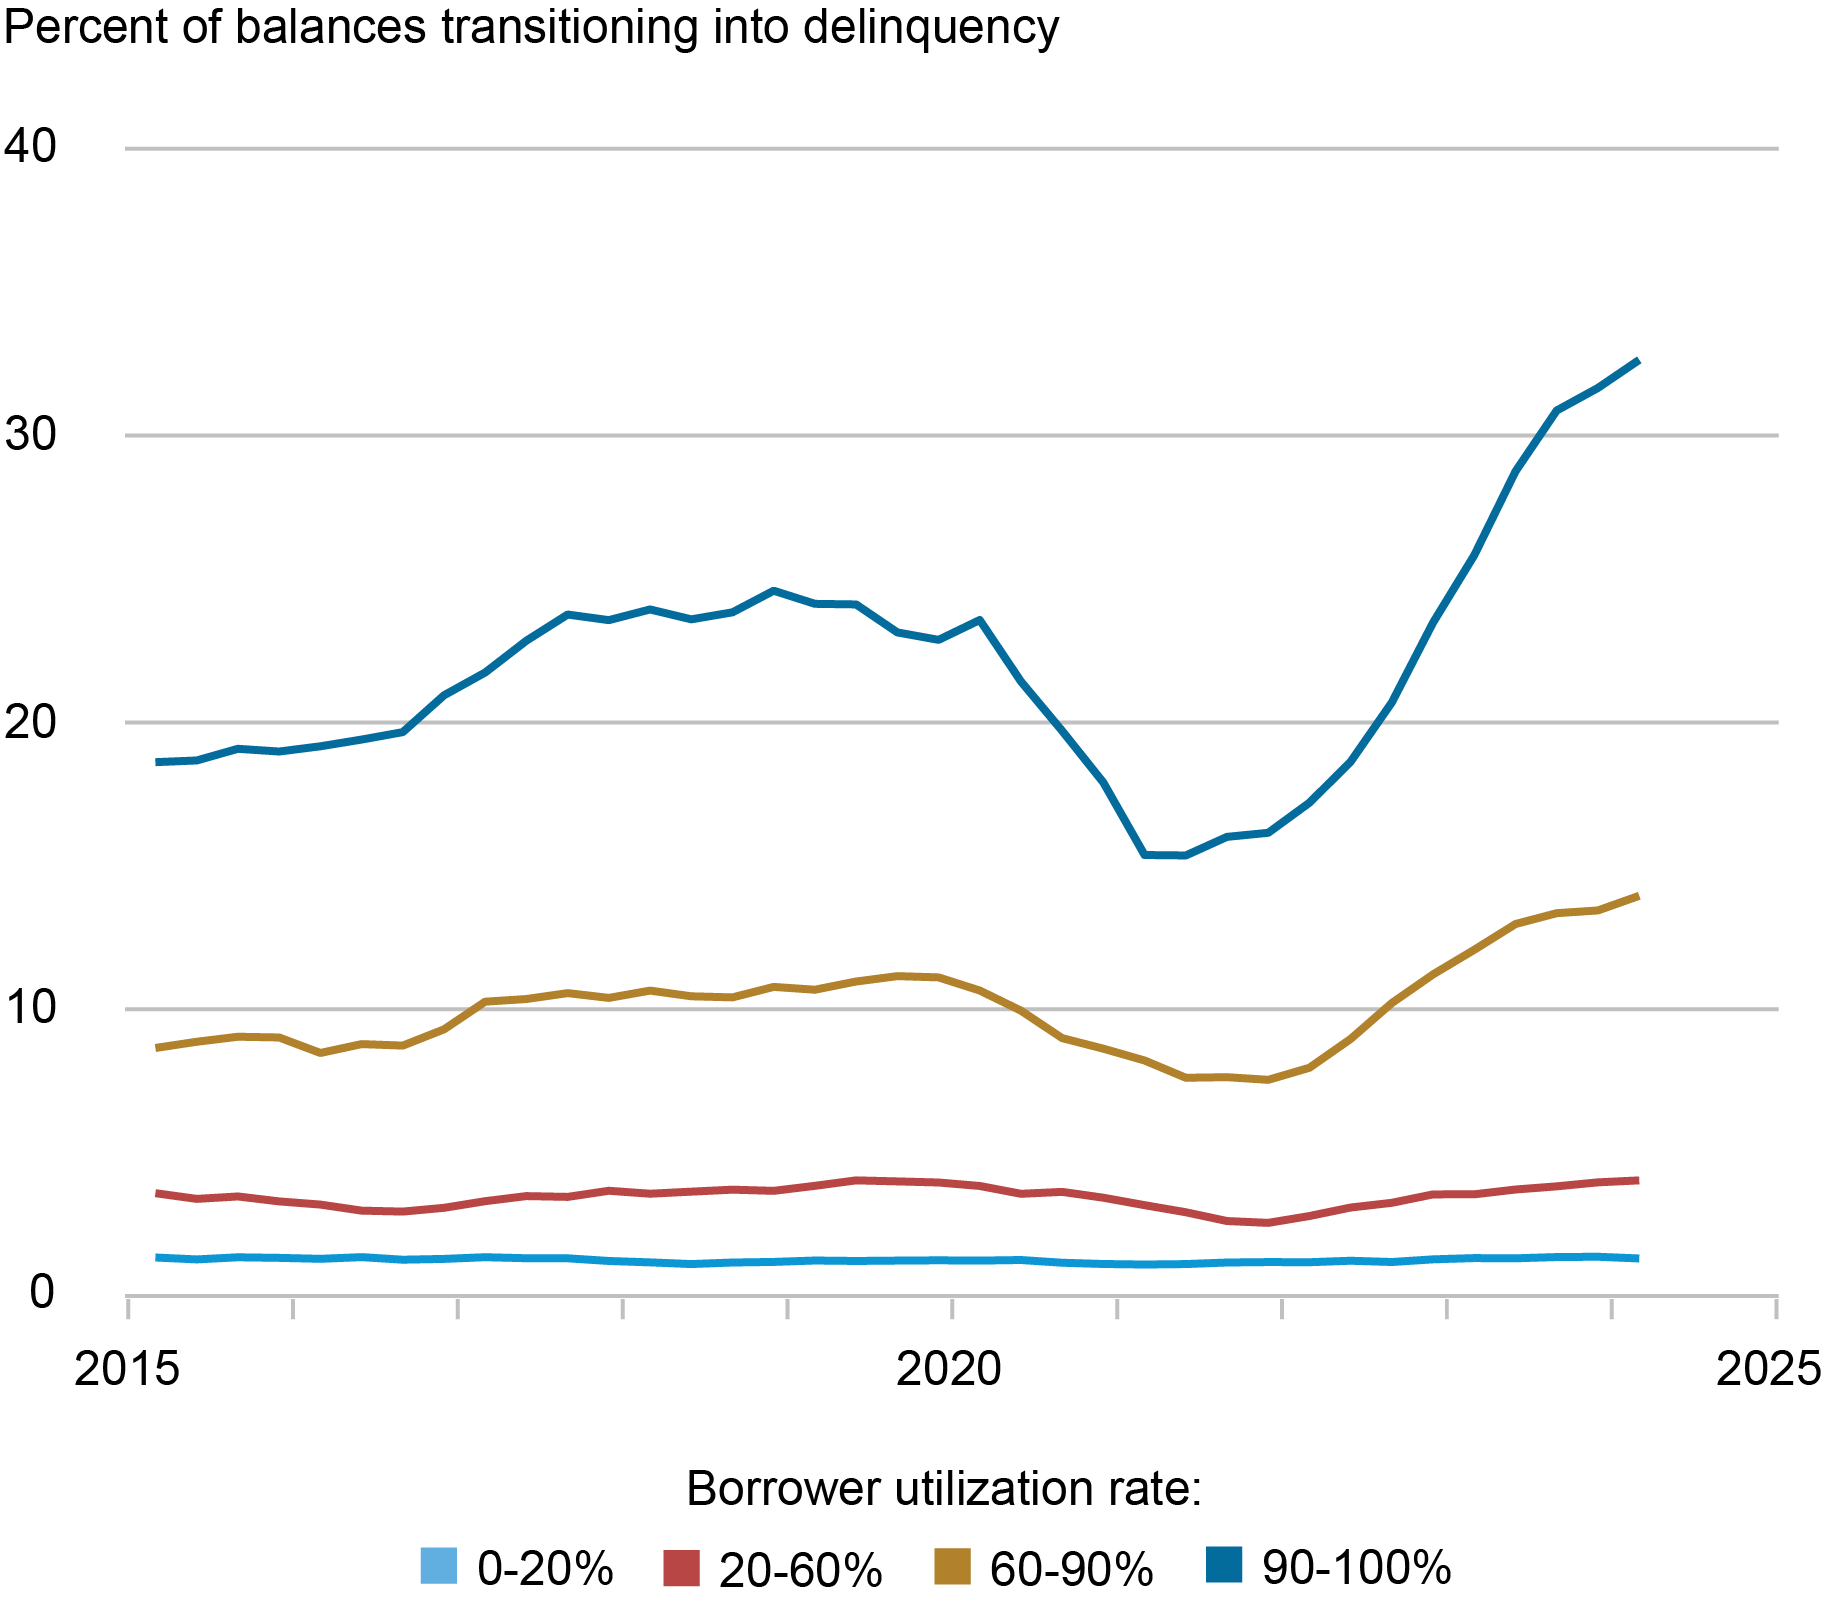
Notes: The chart shows balance-weighted transition to credit card delinquency among borrowers who were current on all credit card accounts in the previous quarter. A borrower’s utilization group is determined by their utilization in the previous quarter. Data are smoothed as four-quarter moving sums to account for seasonal trends.
It should be noted that credit card utilization is a function of both balance and credit limit, and people with lower limits generally have higher utilization rates. Indeed, current borrowers in the 90‑100 percent utilization band had a median total credit limit of $5,000 in the first quarter, less than half of the median $10,050 limit for the 60-90 percent group and less than one-fourth of the 0‑20 percent utilization group’s median limit of $21,000. So, to some degree, utilization rate is also a reflection of underlying credit quality and income because higher credit score borrowers with higher income typically have higher limits and lower utilization rates.
The following table shows median credit card balances and limits and the percentage share of maxed-out borrowers for non-delinquent borrowers in the first quarter of 2024. First, we look at the inputs to utilization by borrowers’ neighborhood income (based on Census block group). Borrowers in higher-income areas are less likely to have high credit card utilization (partially because of differences in credit limits—a median of $25,800 for the highest quartile vs $11,300 for the lowest), despite median balances being more similar across income groups. Note that delinquent borrowers are excluded from this table since most of them are already maxed-out by either spending up to the limit or by the lender lowering the limit to prevent further spending.
Younger Card Users and Card Users Living in Low-Income Areas Are More Likely to Be Maxed-Out
Median Balance | Median Credit Limit | Percentage Maxed-Out | ||
| Income quartile | 1st (lowest) | $1,410 | $11,300 | 12.3% |
| 2nd | $1,597 | $15,000 | 10.2% | |
| 3rd | $1,817 | $18,600 | 8.1% | |
| 4th (highest) | $2,099 | $25,800 | 5.5% | |
| Generation | Gen Z | $760 | $4,500 | 15.3% |
| Millennials | $2,378 | $16,300 | 12.1% | |
| Gen X | $3,017 | $21,800 | 9.6% | |
| Baby boomers | $1,599 | $22,000 | 4.8% |
Sources: New York Fed Consumer Credit Panel/Equifax; American Community Survey.
Notes: A borrower’s income quartile is based on the median household income in their Census block group. A borrower’s generation is based on their birth-year. Baby Boomers are those born between 1946 and 1964, Generation X are 1965 to 1979, Millennials are 1980 to 1994, and Generation Z are 1995 to 2011. Maxed-out denotes borrowers who have 90 percent or higher utilization across all credit cards.
We also separate credit card utilization rate by borrowers’ birth-year generation. The incidence of high-utilization borrowers seems to fall during the life cycle. Very few Baby Boomers are maxed-out, while 15.3 percent of Generation Z credit card users utilize over 90 percent of their credit limit. However, Gen Z borrowers also have low median limits of $4,500, while median limits for older generations range from $16,300 for Millennials to $22,000 for Baby Boomers. Much of this can be attributed to the shorter credit histories, and thus lower credit score, of the youngest generation, and to lower income. Gen Z’s first credit card account is four years old on average, while a Millennial’s is eleven years old. As explored in our post on the third-quarter 2023 Quarterly Report, Gen Z has the highest delinquency transition rate, but Millennials were the only group whose delinquency exceeded their pre-pandemic rate.
The chart below shows a time series of non-delinquent maxed-out borrowers, with the blue line denoting their share among current borrowers and the red line showing the share they hold of aggregate current balances. Credit card borrowers made massive paydowns on their cards in 2020 and 2021, a time during which income rose from pandemic transfers and assistance but consumption opportunities were limited, resulting in a decline in the share of maxed-out borrowers. Since the economy reopened in 2022 and consumption was very strong in 2022 and 2023, credit card balances increased again, resulting in a rise in the share of maxed-out borrowers and their balances. These shares remain slightly lower than the pre-pandemic level but are edging back up.
The Share of Maxed-Out Credit Card Borrowers Continues to Climb
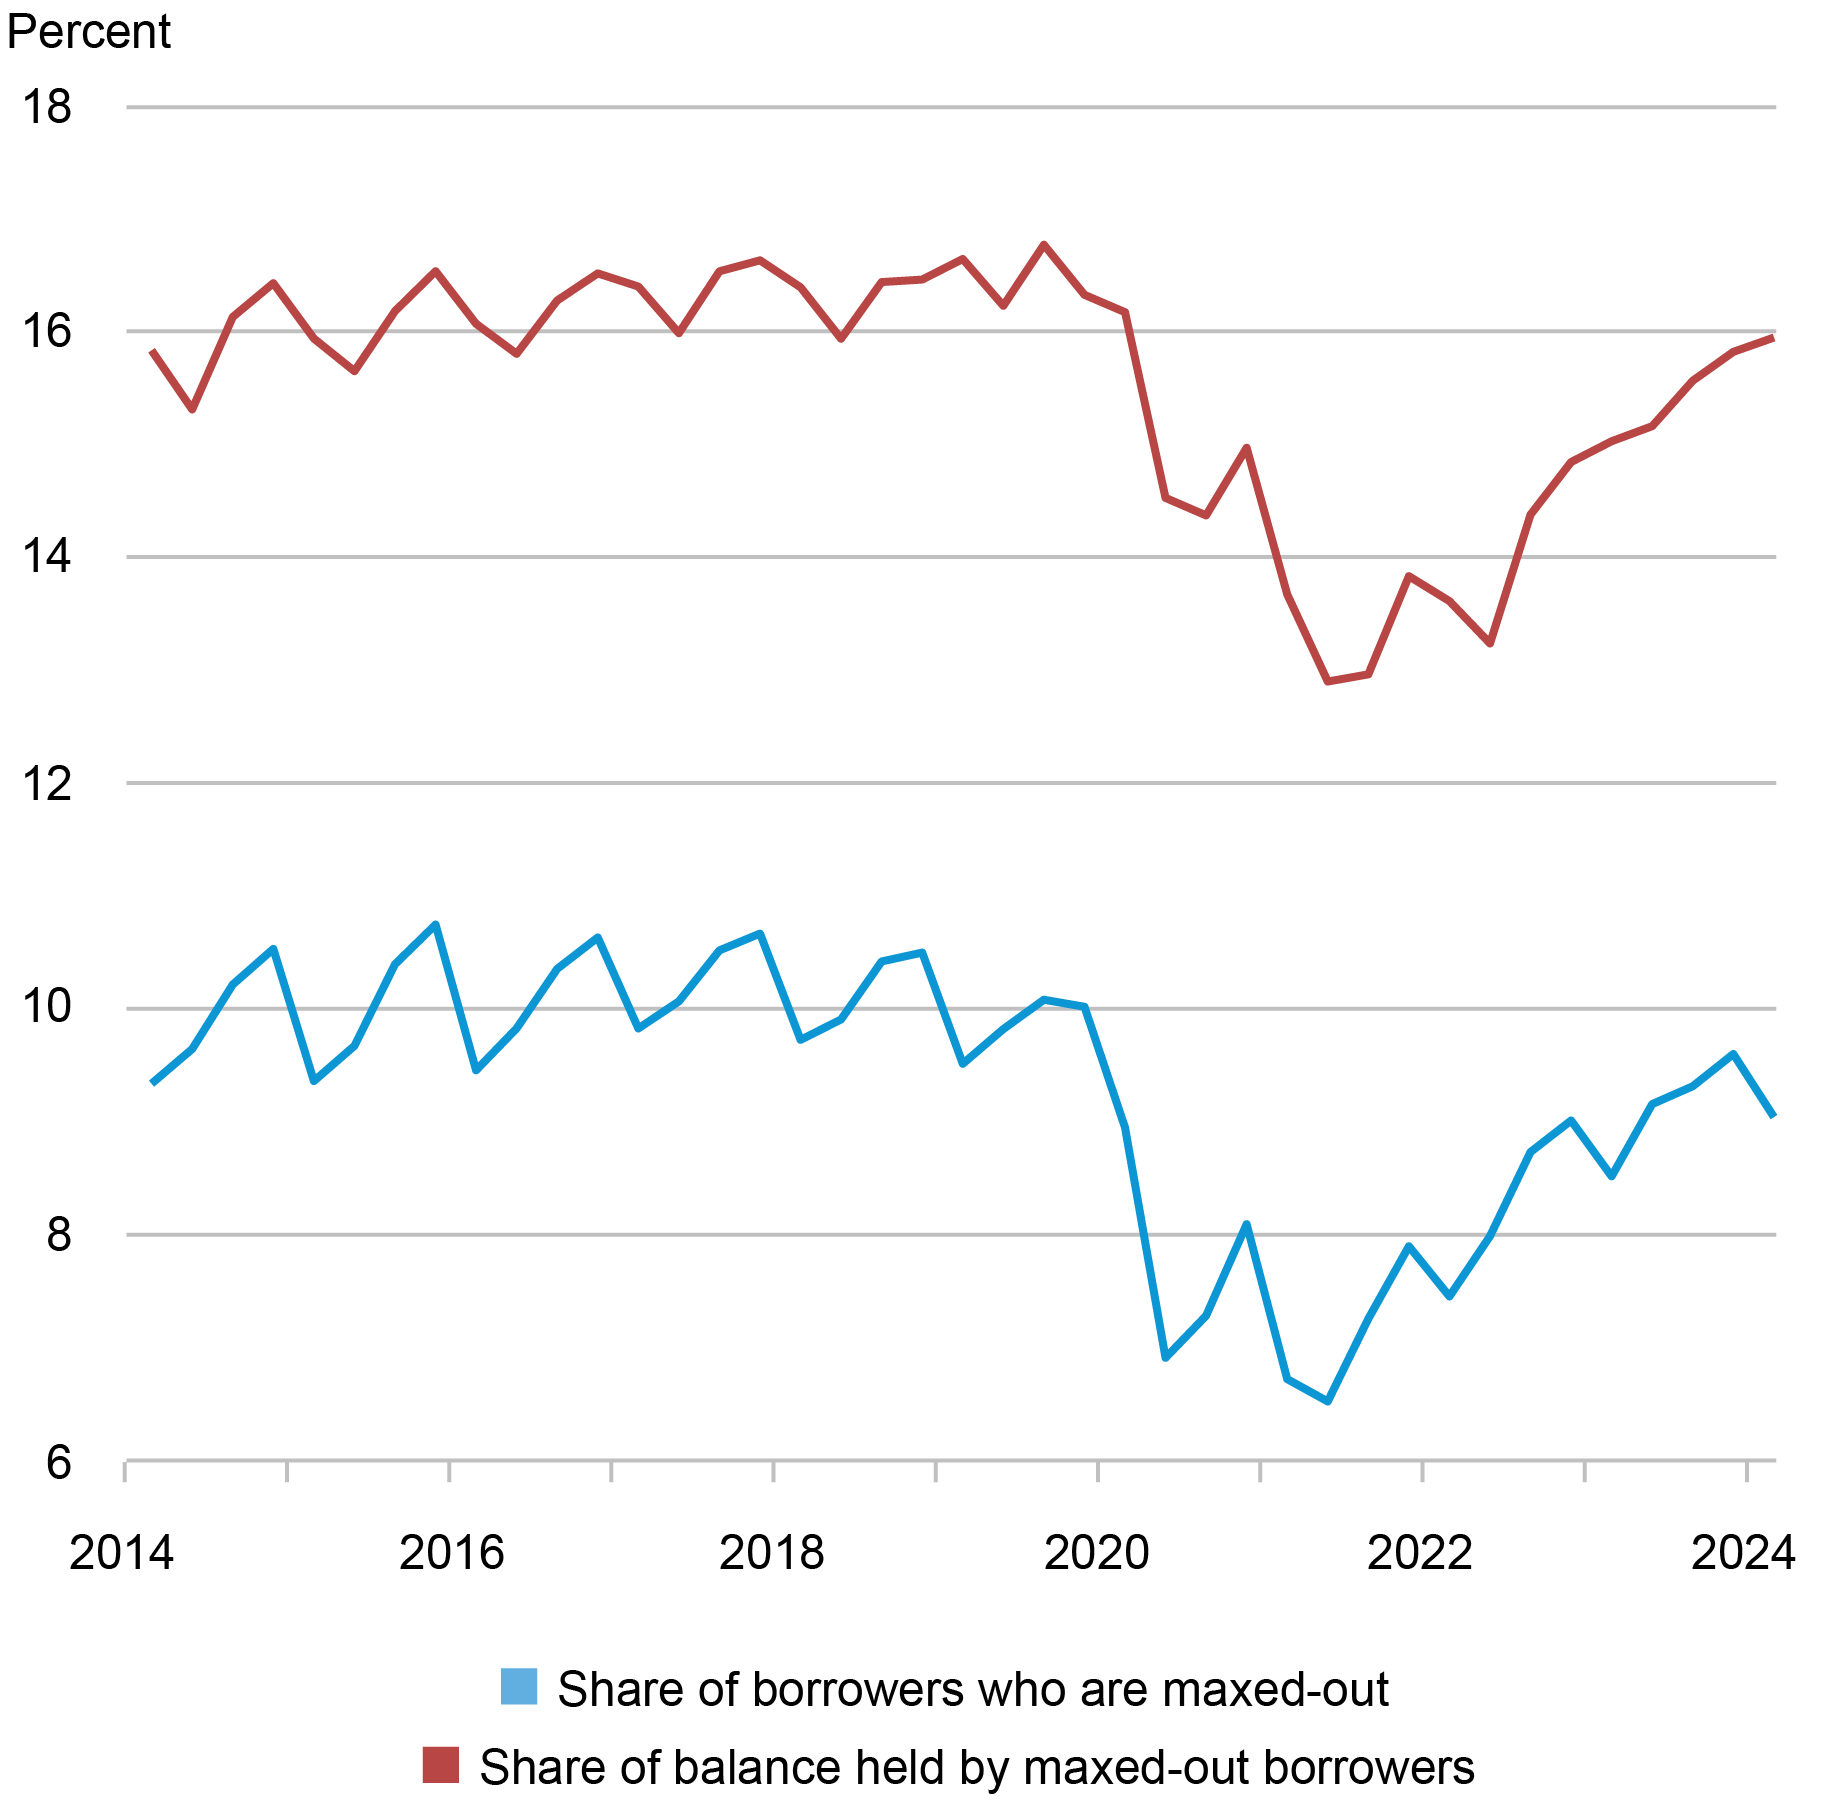
Notes: Maxed-out denotes borrowers who have 90 percent or higher utilization across all credit cards. Delinquent borrowers and balances are excluded. Data are not smoothed and reflect seasonal patterns.
Conclusion
We have shown that new credit card delinquencies are disproportionately ascribable to maxed-out borrowers and their balances. The share of maxed-out borrowers has been increasing from pandemic lows and is approaching pre-pandemic levels, and the delinquency transition rates of these maxed-out borrowers are now noticeably higher than pre-pandemic, resulting in higher transition rates into credit card delinquency overall. For a positive improvement in credit card delinquency, we would need to see the delinquency transition rate among maxed-out borrowers begin to decline and/or the share of maxed-out borrowers to fall. So far, the data show neither of these trends moving in the right direction. If these trends continue and other factors influencing delinquencies remain the same, credit card delinquencies are likely to continue to rise. Of course, macroeconomic conditions can move these trends in either direction, so we will continue to monitor the situation in the coming quarters.

Andrew F. Haughwout is the director of Household and Public Policy Research in the Federal Reserve Bank of New York’s Research and Statistics Group.

Donghoon Lee is an economic research advisor in Consumer Behavior Studies in the Federal Reserve Bank of New York’s Research and Statistics Group.

Daniel Mangrum is a research economist in Equitable Growth Studies in the Federal Reserve Bank of New York’s Research and Statistics Group.

Joelle Scally is a regional economic principal in the Federal Reserve Bank of New York’s Research and Statistics Group.

Wilbert van der Klaauw is the economic research advisor for Household and Public Policy Research in the Federal Reserve Bank of New York’s Research and Statistics Group.

Crystal Wang is a research analyst in the Federal Reserve Bank of New York’s Research and Statistics Group.
How to cite this post:
Andrew F. Haughwout, Donghoon Lee, Daniel Mangrum, Joelle Scally, Wilbert van der Klaauw, and Crystal Wang, “Delinquency Is Increasingly in the Cards for Maxed‑Out Borrowers,” Federal Reserve Bank of New York Liberty Street Economics, May 14, 2024, https://libertystreeteconomics.newyorkfed.org/2024/05/delinquency-is-increasingly-in-the-cards-for-maxed-out-borrowers/.


Disclaimer
The views expressed in this post are those of the author(s) and do not necessarily reflect the position of the Federal Reserve Bank of New York or the Federal Reserve System. Any errors or omissions are the responsibility of the author(s).
 RSS Feed
 Follow Liberty Street Economics
Great insight, thank you very much. I am confused about one thing. Many articles talk about “real debt” and your info compares maxed out vs 2019, but I am curios why the focus isnt also on the dramatic change in the rates to borrow. CC, Mortgage and auto loan rates are about 100% higher +/- vs the end of 2019. If your debt levels are higher and your income are higher, all else being the same you are just as well off, BUT not all things are equal as rates on those loans have skyrocketed. What am i missing?