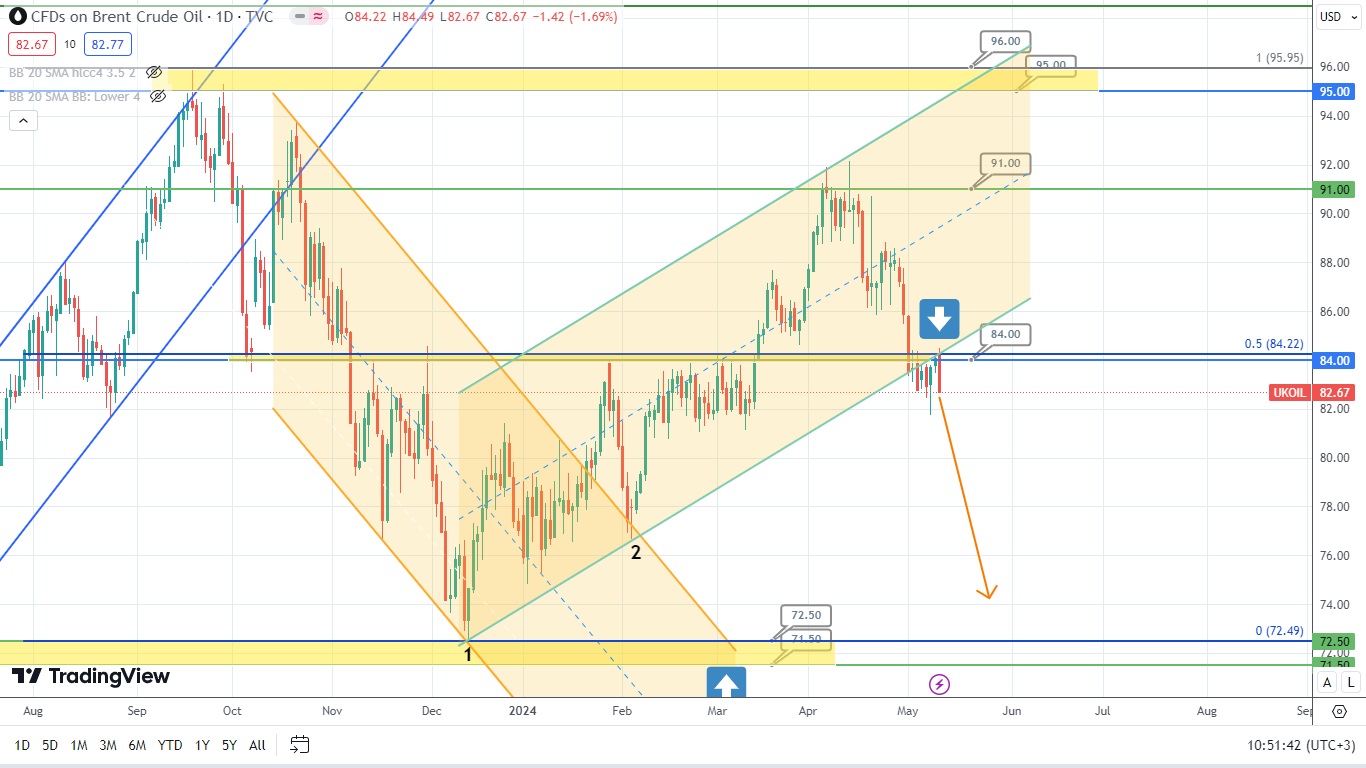
The price of Brent oil broke the key resistance level of 84.00 and started an uptrend. The asset’s price rebounded to the crossing point of these trendlines and formed a long black candle at the end of the trading week to make up for the prior pullback. The price of oil is likely to drop at the beginning of next week. So, let’s observe whether this scenario might work out.

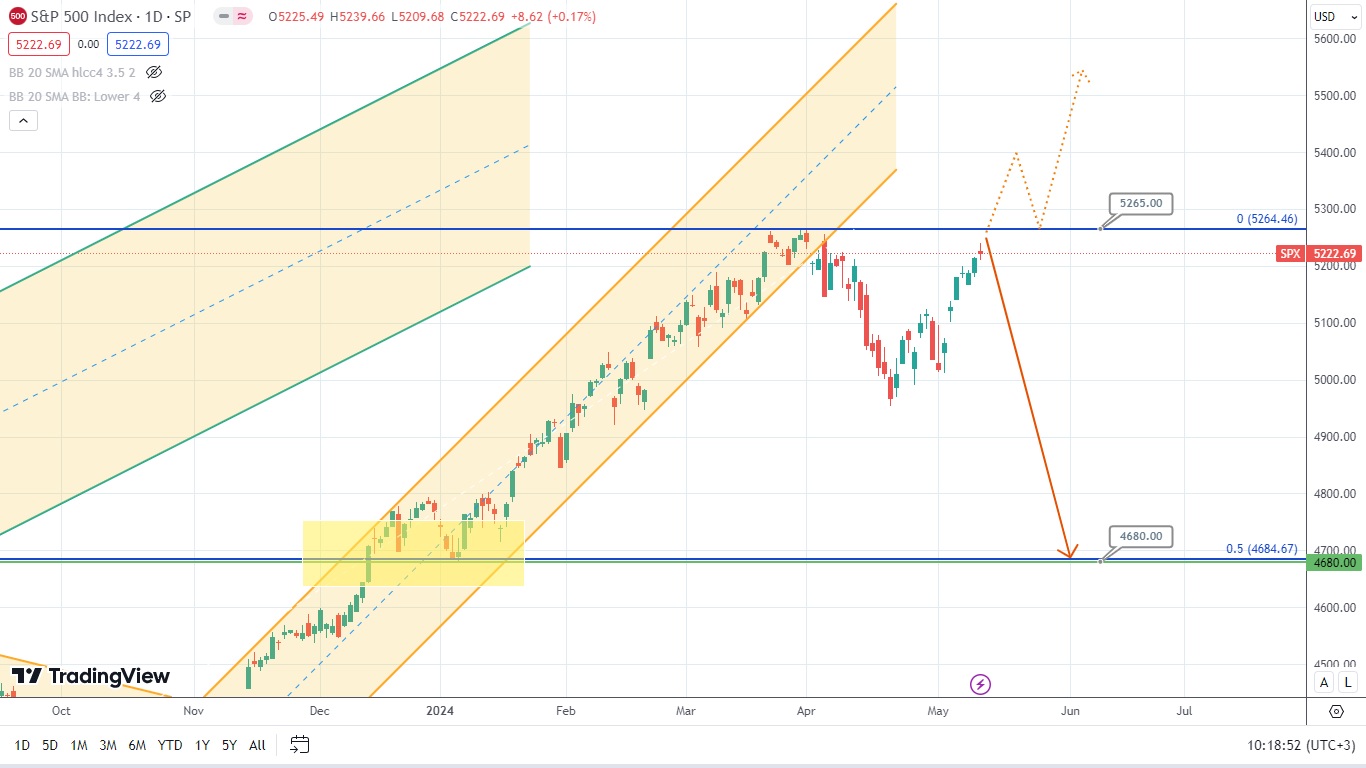
The price of the American stock index S&P500 is gradually approaching a very important historical resistance level of 5265. This resistance might potentially reverse the price of the index and bring it down. Of course, the asset might break through this resistance. In this case, the asset’s price could either jump or form a bullish trap. Hence, at this point, it would be wise to follow the price movements next to this level to try and forecast the upcoming sentiment.
The price of natural gas broke the key psychological level of 2.0. The symmetrical triangle located under this level turned out to be a reversal pattern. Now, the price of this asset might potentially rebound to the broken level and then rise again.

Disclaimer: The material provided is for information purposes only and should not be considered as investment advice. The views, information, or opinions expressed in the text belong solely to the author, and not to the author’s employer, organization, committee or other group or individual or company.
Past performance is not indicative of future results.
High Risk Warning: CFDs are complex instruments and come with a high risk of losing money rapidly due to leverage. 71% and 70% of retail investor accounts lose money when trading CFDs with Tickmill UK Ltd and Tickmill Europe Ltd respectively. You should consider whether you understand how CFDs work and whether you can afford to take the high risk of losing your money.