Senatorial candidate Hovde presents this picture.
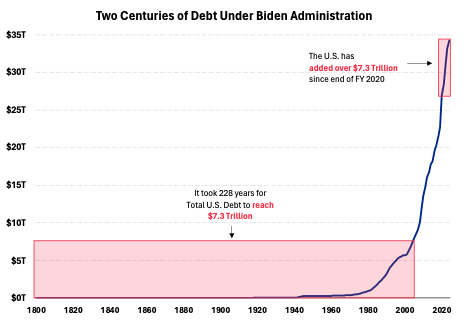
Source: Hovde.
I’ll trust that the candidate’s staff did the adding correctly, although I think the calculation is pretty meaningless. For instance, how does individual colony debt in 1776 get counted? More substantively, does it make sense to report nominal debt over such a long period?* I think maybe nominal debt divided by nominal GDP makes more sense.
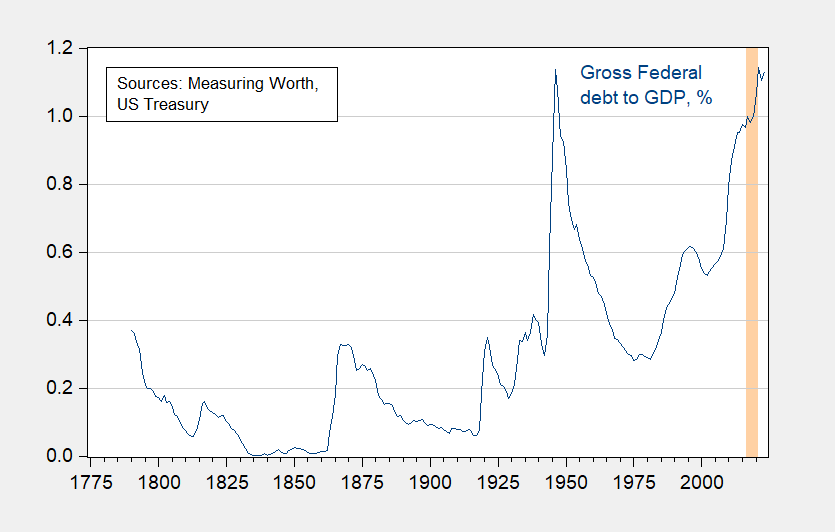
Figure 1: Gross Federal debt, as a percentage of GDP (blue). Note end-FY gross debt as a percentage of calendar year GDP. Orange shading denotes mostly Trump administration (FY2016-FY2020 debt). Source: US Treasury, MeasuringWorth, and author’s calculations.
It’s a little hard to see what the recent context is with annual data (and in recent times, Federal debt held by the public, FRED series FYGFDPUN, makes more sense as a debt measure). Hence, I show the year-on-year percentage point changes in Federal debt held by public to GDP in Figure 2.
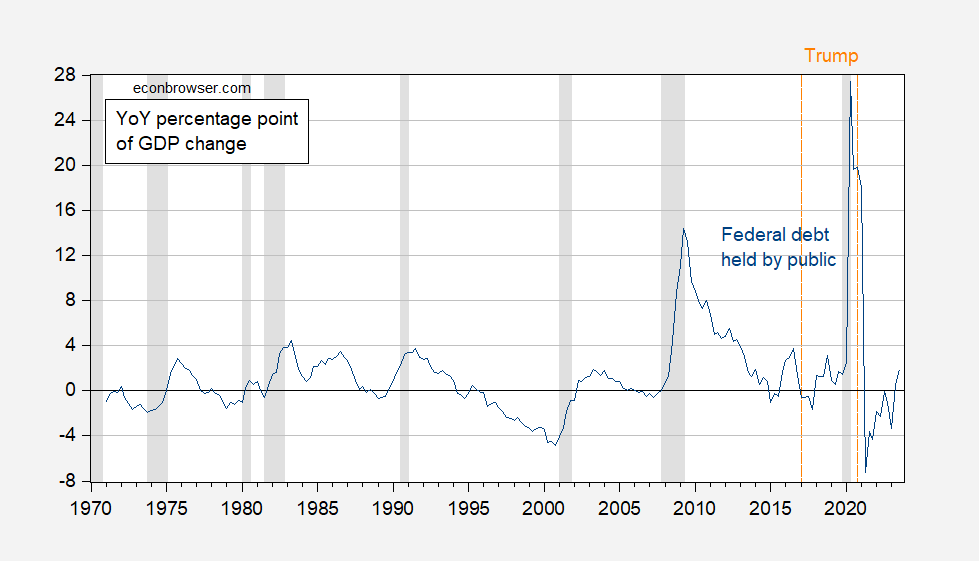
Figure 2: Year-on-Year percentage point change in Federal debt held by public to GDP ratio (blue). NBER defined peak-to-trough recession dates shaded gray. Orange dashed lines at beginning ond end of Trump administration, dated 2017Q1, 2020Q4. Source: US Treasury via FRED, BEA, NBER, and author’s calculations.
The largest percentage point of GDP increase in Federal debt takes place under Mr. Trump’s administration.
For an equally mendacious (and arithmetically incorrect) calculation, see discussion in this post.
* CPI increased by 3501% since 1776 to 2023; nominal GDP is 141750 times what it was in 1790 (data from MeasuringWorth).
“US Risks Fiscal Crisis After Soaring Borrowing, Blanchard Warns; Former IMF chief economist worried about attitude to deficits”
https://www.bloomberg.com/news/articles/2024-02-20/blanchard-warns-of-fiscal-crisis-in-us-after-soaring-borrowing
Federal Outlay of Interest as Percent of Gross Domestic Product is the highest it has been this century.
https://fred.stlouisfed.org/series/FYOIGDA188S
The last link is actually a very informative graph. It show how St. Reagan (who proved deficits don’t matter) gave us a record interest level burden, and Clinton brought that down again. It also show how minimal a burden that was (3%) relative to the total size of the economy. So even the worst of the debt burden panic is a little silly.
The best way to understand the national debt is as a taxation deficit. If it becomes a problem you just have to raise taxes to pay it down. I think Krugman explained the “generational concern” nicely when he pointed out that both the national debt burden and the wealth (treasuries) to pay it down are transferred from one generation to the next. If you are concerned about the national debt then tax those treasuries right out of the pockets of rich people. Then they will neither transfer the national debt (taxation deficit) to the next generation, nor the wealth (privately held treasuries) to cover it.
National debt is not a big deal. Its all about stupid little pieces of paper being printed and shuffled into one file cabinet or the other (or the electronic equivalent of that) – making some people feeling oh so good, for possessing those papers and ignoring their associated responsibility towards the collective.
Domar would be impressed with your comment. Jonny boy? This MORON has no idea who Domar was.
pgl’s random nonsense generator is on steroids.
Qi figured you’d ha e no clue Domar was. After all you are a very ignorant moron
“Federal Outlay of Interest as Percent of Gross Domestic Product is the highest it has been this century.”
This graph misuses the nominal interest rate rather than the real interest rate. Properly calculated the real interest expense/GDP is closer to 1.2% than 2.4%.
Everyone with half a brain who even remotely understands this issue gets my point. But not our little Jonny boy.
In the US, I’m very worried because the primary deficits are very large. There’s absolutely no attempt to decrease them in any way, shape or form,” said Blanchard to the House of Lords Economic Affairs Committee
What Blanchard said but of course little Jonny boy did not note this. Why? Because it is too complicated for little Jonny boy. But let s = primary surplus/GDP where this surplus is tax minus non-interest government spending. The debt/GDP ratio will fall slowly over time if s/(r – g) exceeds debt/GDP. r being the REAL INTEREST RATE and g = the long-run growth of real GDP.
Everyone know this from Domar to Sargent and Wallace to Barro to Friedman, Tobin, Krugman, Blanchard, and Jason Furman. But of course not our little Jonny boy!
Actually, Blanchard is probably looking at: “In CBO’s projections, the total budget deficit—the amount by which outlays exceed revenues—equals 6.1 percent of GDP in 2034. Net interest payments grow in relation to GDP, reaching 3.9 percent of GDP in 2034….
Federal debt held by the public increases each year in CBO’s projections, swelling to an all-time record of 116 percent of GDP in 2034. In the two decades that follow, growing deficits are projected to cause federal debt to soar to 172 percent of GDP by 2054.”
https://www.cbo.gov/publication/59946
So much for pgl’s wishful thinking that “the debt/GDP ratio will fall slowly over time.”
You actually read the CBO document? Not that you understand a word of it. You certainly have no clue what Blancard has said
JohnH never ceases to amaze me at how utterly stupid he is. Blanchard mentions the primary deficit (surplus) – a basic concept I suggested Jonny boy has no about. And true to form Jonny makes a dumb comment about Blanchard needed to rely on CBO? WTF? Hey Jonny boy I read the CBO document and noted its implicit assumptions about the primary deficit. So why don”t you try the same damn exercise? Oh you don’t know how.
And no I did not assume that under current policies (which is what the CBO is constrained to do) that debt/GDP will fall. No you little pathetic moron, I noted the changes in fiscal policy that would be required to avoid a debt explosion.
But once again Jonny’s own comments proves he never had a clue about this topic. None at all.
“Hey Jonny boy I read the CBO document and noted its implicit assumptions about the primary deficit. So why don”t you try the same damn exercise? Oh you don’t know how.”
Jonny boy was challenged to do some really simply – he failed. The first damn table of the CBO report makes this easy. By 2034, taxes/GDP will still be less than 18%. Outlays net of interest expenses just over 20%. Gee – my two your old gets that the primary deficit is 2% of GDP. And since we need a primary surplus that is at least 1% of GDP. My two your old just told me that we need to raise taxes by 3% of GDP. But my two year old is smart. My mentally retarded stalker could not this exercise as he is a MORON.
“Federal Outlay of Interest as Percent of Gross Domestic Product is the highest it has been this century.”
Highest it has been in the last 25 years. Yea Jonny boy lies even about this.
What IS the debt? It is the total face value of all the Treasury bonds in circulation. The T-bill market provides a very valuable market service to the US and the international financial markets, but if there were some powerful reason to “eliminate the debt” – could the Treasury not buy back the bonds at market value? In a sense, T-bills are just another tradable form of US currency.
What is the “deficit”? It is the excess of Congressional expeditures beyond the tax revenues. So, the effect of the deficit is simply to increase the money supply – Congressional appropriations are not contingent on tax revenue: when Congress appropriates, the Treasury simply credits the relevant department with the money (from thin air). That would be bad if the money supply increased faster than the economy and produced inflation; and it would be bad if the money supply FAILED to keep pace with the economy and produced deflation. But the money supply and the economy have parity and there is not excessive inflation – therefore the deficit is exactly what it SHOULD BE.
CLOSE……. 5-stars for Cade, who saw something Menzie and the “orthodoxy” NEVER saw.
Cade, orthodox economists only ever jizz themselves and got their trousers creamed when the CURRENT head of “the Fed” gifts it.
The whole concept of budget deficits and debt is misleading.
The federal government pass a budget that decides what needs to be spend on society. The difference between that spending and federal government income is not a (federal) budget deficit it is a (federal) TAXATION DEFICIT. As that accumulates year after year it is not the national debt it is the CUMULATIVE TAXATION DEFICIT. Let’s stop this misleading mislabeling and begin talk about things as what they actually are.
Hovde = Bruce Hall. I read his screed. Dumb as it gets.
“The CUMULATIVE TAXATION DEFICIT. Let’s stop this misleading mislabeling and begin talk about things as what they actually are.”
Anyone know a politician brave enough to speak truth to the top 1% or to Corporate America?
Politicians brave enough to “blah, blah, blah” meaning raise taxes on the rich? Yes, I do. For instance:
Bidens tax plan for 2024 “include tax rate increases on households making $400,000 or more and corporations, and big changes in taxation of multinational corporations. Other proposals would curb the use of carried interest by investment firms, limit very large retirement accounts, and ban so-called “wash-sales” by investors in cryptocurrency.”
https://www.taxpolicycenter.org/taxvox/first-look-revenue-provisions-bidens-2024-budget
Biden’s Build Back Better plan “proposed over $3.5 trillion in new taxes, including raising the corporate rate to 28% from 21% and returning the top individual rate to 39.6% from 37% and taxing capital gains at those rates for Americans earning over $1 million. He promised no increases for those earning under $400,000 a year.”
https://www.reuters.com/world/us/us-debt-ceiling-deal-dooms-bidens-revolutionary-tax-plans-2023-06-01/
Congressional Democrats, under Obama, allowed tax breaks for the rich to expire, while increasing capital gains, dividend and estate tax rates.
Congressional Democrats during Clinton’s first term increased the top rate on individuals and businesses, while cutting taxes on small businesses. They did, however, cut capital gains tax rates.
Here’s the pattern of the highest marginal tax rate for individuals, which makes it perfectly obvious that some politicians are willing to take action which doesn’t serve the rich. They tend to be Democrats. Anyone who isn’t aware of this simple fact has no business shooting his mouth off about politicians. Johnny, in particular, regularly attacks Democrats for doing nothing for the poor while favoring the rich, without ever mentioning Republicans, who actively harm the poor and serve the rich.
The tax rate picture, as promised:
https://fred.stlouisfed.org/graph/?g=1hVVM
You admire FDR. In the midst of still recovering from the Great Depression, he had this top rate raised from 25% to near 80%.
One meaningless comment after another… Yqou have no clue. None at all
ponzi johnny, are you still advocating for higher rates of return on risk free assets? money for nothing, as a wise man direly strated.
‘Since the end of the 2020 fiscal year, President Biden and Senator Baldwin have added over $7.3 trillion of debt, more than the first 228 years of our nation’s history combined.’
That is what we call a lie. The debt reached $7.3 billion by 2004. His graph claims it reached this level only by 2020.
In case everyone has forgotten what led to the last spike in national debt:
https://home.treasury.gov/policy-issues/coronavirus/assistance-for-american-families-and-workers/economic-impact-payments
Depending on the source and bias, the economic shutdowns were wholly warranted or unnecessary.
2020
https://www.cbsnews.com/news/us-economy-shutdown-coronavirus-saved-2-7-million-lives/
2022
https://health.wusf.usf.edu/health-news-florida/2022-02-02/a-johns-hopkins-study-says-ill-founded-lockdowns-did-little-to-limit-covid-deaths
Regardless, the shutdowns happened and the treasury dumps happened. The shutdowns tanked the 2020 economy. The treasury dumps occurred in both the Trump and Biden administrations. One could endlessly debate whether or not either should have happened. But the economic shutdowns certainly affected the equation’s denominator in 2020.
Hey dude – the debt/GDP ratio rose a lot from 2017 to 2019. But I guess a troll like you would blame Jimmy Carter. But many thanks for reminding us that Trump let the COVID crisis get out of control. How are you doing on bleach?
“The treasury dumps occurred in both the Trump and Biden administrations. One could endlessly debate whether or not either should have happened.”
Let’s see – the debt/GDP ratio to 133% in Trump’s last year but did little Brucie forget to note how this fell to 117% by early 2023 (Under Biden)?
Most people would call this an effective stabilizer but things like countercyclical policy or automatic stabilizers are matters that little Brucie never got.