Markets
Mapped: Inflation Projections by Country, in 2024
![]() See this visualization first on the Voronoi app.
See this visualization first on the Voronoi app.
Inflation Projections, by Country in 2024
This was originally posted on our Voronoi app. Download the app for free on iOS or Android and discover incredible data-driven charts from a variety of trusted sources.
Global economic prospects hang on a delicate balance, largely hinging on the path of inflation.
While inflation looks to be easing, there remains the risk of a second wave of price pressures driven by geopolitical conflicts and supply disruptions in the Red Sea. Adding to this, a stronger than expected labor market could drive consumer demand, pushing up higher prices.
This graphic shows 2024 inflation projections around the world, based on forecasts from the International Monetary Fund (IMF).
Is Global Inflation On a Downward Path?
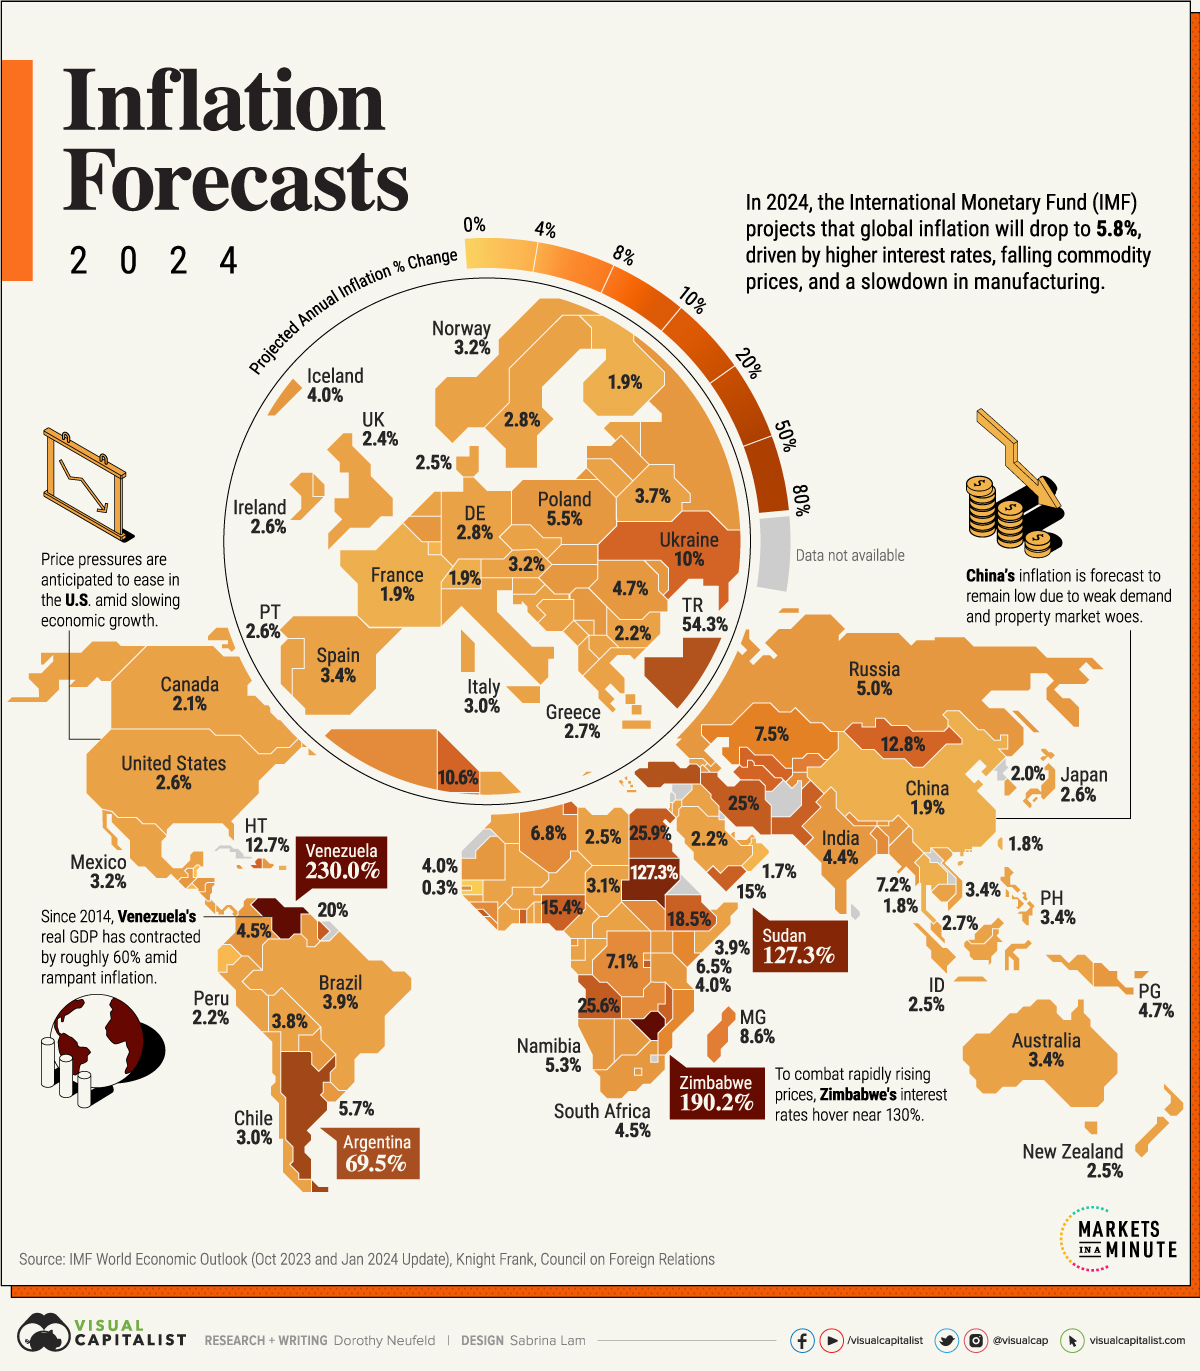
In 2024, global inflation is projected to decline to 5.8%, down from a 6.8% estimated annual average in 2023.
Tighter monetary policy and falling energy prices are forecast to dampen price pressures alongside a cooling labor market. Below, we show inflation projections across 190 countries:
| Country | Projected Annual Inflation Change 2024 |
|---|---|
| 🇻🇪 Venezuela | 230.0% |
| 🇿🇼 Zimbabwe | 190.2% |
| 🇸🇩 Sudan | 127.3% |
| 🇦🇷 Argentina | 69.5% |
| 🇹🇷 Türkiye | 54.3% |
| 🇪🇬 Egypt | 25.9% |
| 🇦🇴 Angola | 25.6% |
| 🇮🇷 Iran | 25.0% |
| 🇧🇮 Burundi | 22.4% |
| 🇸🇱 Sierra Leone | 21.7% |
| 🇸🇷 Suriname | 20.0% |
| 🇪🇹 Ethiopia | 18.5% |
| 🇵🇰 Pakistan | 17.5% |
| 🇳🇬 Nigeria | 15.4% |
| 🇲🇼 Malawi | 15.2% |
| 🇬🇭 Ghana | 15.0% |
| 🇾🇪 Yemen | 15.0% |
| 🇲🇳 Mongolia | 12.8% |
| 🇭🇹 Haiti | 12.7% |
| 🇺🇿 Uzbekistan | 10.7% |
| 🇹🇳 Tunisia | 10.6% |
| 🇹🇲 Turkmenistan | 10.0% |
| 🇺🇦 Ukraine | 10.0% |
| 🇲🇬 Madagascar | 8.6% |
| 🇰🇬 Kyrgyz Republic | 8.0% |
| 🇿🇲 Zambia | 7.9% |
| 🇲🇺 Mauritius | 7.8% |
| 🇬🇳 Guinea | 7.8% |
| 🇰🇿 Kazakhstan | 7.5% |
| 🇧🇩 Bangladesh | 7.2% |
| 🇲🇲 Myanmar | 7.2% |
| 🇸🇹 São Tomé and Príncipe | 7.2% |
| 🇬🇲 The Gambia | 7.1% |
| 🇨🇩 Democratic Republic of the Congo | 7.1% |
| 🇩🇿 Algeria | 6.8% |
| 🇹🇯 Tajikistan | 6.5% |
| 🇳🇵 Nepal | 6.5% |
| 🇰🇪 Kenya | 6.5% |
| 🇲🇿 Mozambique | 6.5% |
| 🇹🇴 Tonga | 6.2% |
| 🇸🇸 South Sudan | 6.1% |
| 🇱🇷 Liberia | 6.0% |
| 🇺🇾 Uruguay | 5.7% |
| 🇻🇺 Vanuatu | 5.6% |
| 🇵🇱 Poland | 5.5% |
| 🇬🇾 Guyana | 5.5% |
| 🇷🇼 Rwanda | 5.5% |
| 🇭🇺 Hungary | 5.4% |
| 🇳🇦 Namibia | 5.3% |
| 🇬🇶 Equatorial Guinea | 5.2% |
| 🇧🇹 Bhutan | 5.1% |
| 🇦🇿 Azerbaijan | 5.0% |
| 🇯🇲 Jamaica | 5.0% |
| 🇱🇸 Lesotho | 5.0% |
| 🇲🇩 Moldova | 5.0% |
| 🇷🇺 Russia | 5.0% |
| 🇺🇬 Uganda | 5.0% |
| 🇳🇮 Nicaragua | 4.8% |
| 🇵🇬 Papua New Guinea | 4.7% |
| 🇷🇴 Romania | 4.7% |
| 🇬🇹 Guatemala | 4.6% |
| 🇼🇸 Samoa | 4.5% |
| 🇿🇦 South Africa | 4.5% |
| 🇸🇰 Slovak Republic | 4.5% |
| 🇨🇴 Colombia | 4.5% |
| 🇮🇳 India | 4.4% |
| 🇧🇼 Botswana | 4.4% |
| 🇸🇿 Eswatini | 4.3% |
| 🇱🇻 Latvia | 4.3% |
| 🇭🇳 Honduras | 4.2% |
| 🇳🇷 Nauru | 4.2% |
| 🇧🇪 Belgium | 4.0% |
| 🇮🇸 Iceland | 4.0% |
| 🇹🇿 Tanzania | 4.0% |
| 🇰🇮 Kiribati | 4.0% |
| 🇲🇷 Mauritania | 4.0% |
| 🇵🇾 Paraguay | 4.0% |
| 🇷🇸 Serbia | 4.0% |
| 🇩🇴 Dominican Republic | 4.0% |
| 🇦🇲 Armenia | 4.0% |
| 🇧🇷 Brazil | 3.9% |
| 🇸🇴 Somalia | 3.9% |
| 🇹🇻 Tuvalu | 3.8% |
| 🇧🇴 Bolivia | 3.8% |
| 🇧🇾 Belarus | 3.7% |
| 🇨🇲 Cameroon | 3.7% |
| 🇽🇰 Kosovo | 3.7% |
| 🇪🇪 Estonia | 3.6% |
| 🇧🇧 Barbados | 3.6% |
| 🇸🇧 Solomon Islands | 3.6% |
| 🇦🇱 Albania | 3.6% |
| 🇦🇺 Australia | 3.4% |
| 🇪🇸 Spain | 3.4% |
| 🇵🇭 Philippines | 3.4% |
| 🇻🇳 Vietnam | 3.4% |
| 🇲🇦 Morocco | 3.3% |
| 🇸🇮 Slovenia | 3.3% |
| 🇦🇹 Austria | 3.2% |
| 🇭🇷 Croatia | 3.2% |
| 🇨🇬 Republic of Congo | 3.2% |
| 🇳🇴 Norway | 3.2% |
| 🇸🇬 Singapore | 3.2% |
| 🇲🇽 Mexico | 3.2% |
| 🇹🇩 Chad | 3.1% |
| 🇲🇪 Montenegro | 3.1% |
| 🇱🇹 Lithuania | 3.1% |
| 🇨🇷 Costa Rica | 3.0% |
| 🇰🇭 Cambodia | 3.0% |
| 🇮🇹 Italy | 3.0% |
| 🇨🇱 Chile | 3.0% |
| 🇬🇪 Georgia | 3.0% |
| 🇬🇼 Guinea-Bissau | 3.0% |
| 🇮🇶 Iraq | 3.0% |
| 🇱🇦 Lao P.D.R. | 3.0% |
| 🇫🇲 Micronesia | 3.0% |
| 🇩🇲 Dominica | 2.9% |
| 🇸🇪 Sweden | 2.8% |
| 🇩🇪 Germany | 2.8% |
| 🇬🇷 Greece | 2.7% |
| 🇲🇾 Malaysia | 2.7% |
| 🇮🇪 Ireland | 2.6% |
| 🇯🇵 Japan | 2.6% |
| 🇫🇯 Fiji | 2.6% |
| 🇲🇭 Marshall Islands | 2.6% |
| 🇬🇩 Grenada | 2.6% |
| 🇺🇸 United States | 2.6% |
| 🇵🇹 Portugal | 2.6% |
| 🇮🇱 Israel | 2.6% |
| 🇧🇸 The Bahamas | 2.6% |
| 🇯🇴 Jordan | 2.6% |
| 🇱🇾 Libya | 2.5% |
| 🇳🇿 New Zealand | 2.5% |
| 🇧🇯 Benin | 2.5% |
| 🇩🇰 Denmark | 2.5% |
| 🇩🇯 Djibouti | 2.5% |
| 🇸🇲 San Marino | 2.5% |
| 🇹🇱 Timor-Leste | 2.5% |
| 🇮🇩 Indonesia | 2.5% |
| 🇦🇬 Antigua and Barbuda | 2.5% |
| 🇳🇪 Niger | 2.5% |
| 🇨🇫 Central African Republic | 2.5% |
| 🇵🇸 West Bank and Gaza | 2.5% |
| 🇲🇻 Maldives | 2.4% |
| 🇲🇹 Malta | 2.4% |
| 🇳🇱 Netherlands | 2.4% |
| 🇸🇨 Seychelles | 2.4% |
| 🇬🇧 United Kingdom | 2.4% |
| 🇬🇦 Gabon | 2.4% |
| 🇰🇳 St. Kitts and Nevis | 2.3% |
| 🇭🇰 Hong Kong SAR | 2.3% |
| 🇲🇰 North Macedonia | 2.3% |
| 🇦🇪 UAE | 2.3% |
| 🇹🇹 Trinidad and Tobago | 2.3% |
| 🇶🇦 Qatar | 2.3% |
| 🇵🇦 Panama | 2.2% |
| 🇸🇦 Saudi Arabia | 2.2% |
| 🇵🇪 Peru | 2.2% |
| 🇨🇾 Cyprus | 2.2% |
| 🇨🇿 Czech Republic | 2.2% |
| 🇹🇬 Togo | 2.2% |
| 🇧🇬 Bulgaria | 2.2% |
| 🇦🇼 Aruba | 2.2% |
| 🇨🇦 Canada | 2.1% |
| 🇧🇦 Bosnia and Herzegovina | 2.1% |
| 🇱🇨 St. Lucia | 2.1% |
| 🇦🇩 Andorra | 2.0% |
| 🇧🇫 Burkina Faso | 2.0% |
| 🇨🇻 Cabo Verde | 2.0% |
| 🇨🇮 Côte d'Ivoire | 2.0% |
| 🇰🇷 Korea | 2.0% |
| 🇲🇱 Mali | 2.0% |
| 🇻🇨 St. Vincent and the Grenadines | 2.0% |
| 🇨🇭 Switzerland | 1.9% |
| 🇵🇷 Puerto Rico | 1.9% |
| 🇨🇳 China | 1.9% |
| 🇫🇮 Finland | 1.9% |
| 🇫🇷 France | 1.9% |
| 🇹🇼 Taiwan | 1.8% |
| 🇵🇼 Palau | 1.8% |
| 🇹🇭 Thailand | 1.8% |
| 🇱🇺 Luxembourg | 1.7% |
| 🇸🇻 El Salvador | 1.7% |
| 🇲🇴 Macao SAR | 1.7% |
| 🇴🇲 Oman | 1.7% |
| 🇰🇲 Comoros | 1.6% |
| 🇧🇳 Brunei Darussalam | 1.5% |
| 🇪🇨 Ecuador | 1.5% |
| 🇧🇭 Bahrain | 1.4% |
| 🇧🇿 Belize | 1.2% |
| 🇸🇳 Senegal | 0.3% |
Venezuela, with the largest oil reserves globally, is projected to see inflation reach 230%—the highest overall.
Across the last decade, the country has faced hyperinflation, reaching a stunning 10 million percent in 2019. Since U.S. sanctions were lifted last year, inflation has fallen dramatically due to sharp cuts in government spending and increasing dollarization of the economy, which is bolstering the bolivar.
In America, slower economic growth coupled with a softening labor market could ease inflation, which is forecast to reach 2.6% in 2024. While the Federal Reserve has signaled that the worst is over, unexpected momentum across the economy could cloud the outcome. As of November 2023, $290 billion in excess savings were held across American households, which may continue to spur consumer demand.
Over in Europe, inflation is anticipated to average 3.3% across advanced economies. Today, sinking natural gas prices and low GDP growth are keeping inflation expectations at bay.
China, the world’s second-largest economy, is contending with falling prices due to property market trouble, which drives about a third of the country’s economic growth. Amid sluggish economic activity, a manufacturing slowdown, and low consumer confidence, inflation is forecast to reach 1.7%.
What Could Cause Inflation to Re-Accelerate?
While inflation shocks driven from the pandemic appear to be over, key risks could drive up inflation:
- Geopolitical Pressures: Rising shipping costs due to the conflict in the Middle East and Red Sea could continue to escalate and energy prices could increase amid disrupted supply, driving inflation higher.
- Strong Consumer Demand: Accumulated excess savings could continue to fuel economies, leading central banks to remain hawkish. Persistently high wage growth—which increased about double the pre-pandemic average across advanced nations in 2023—could boost consumption and higher prices.
- Rising Housing Costs: Shelter makes up about a third of the Consumer Price Index, the biggest component overall. If prices accelerate, it presents key inflationary risks. As of January 2024, U.S. shelter costs increased 6% annually.
So far, the global economy has been resilient. While risk factors remain, inflation projections suggest that the path towards a 2% target is slow, but going in the right direction.


Markets
What History Reveals About Interest Rate Cuts
How have previous cycles of interest rate cuts in the U.S. impacted the economy and financial markets?
What History Reveals About Interest Rate Cuts
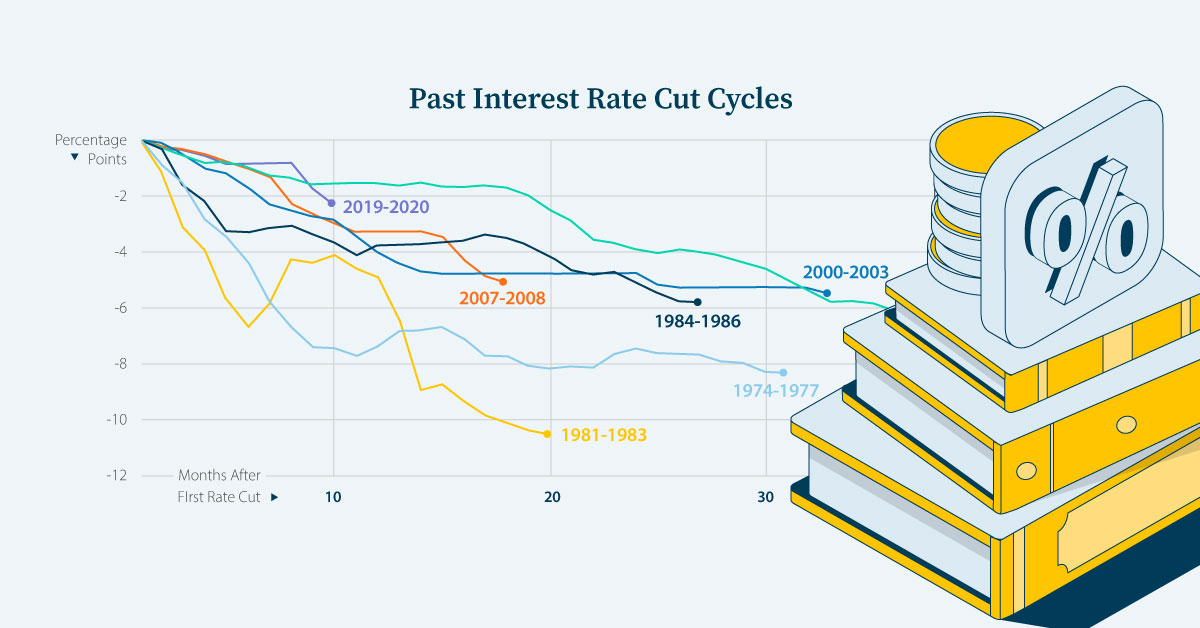
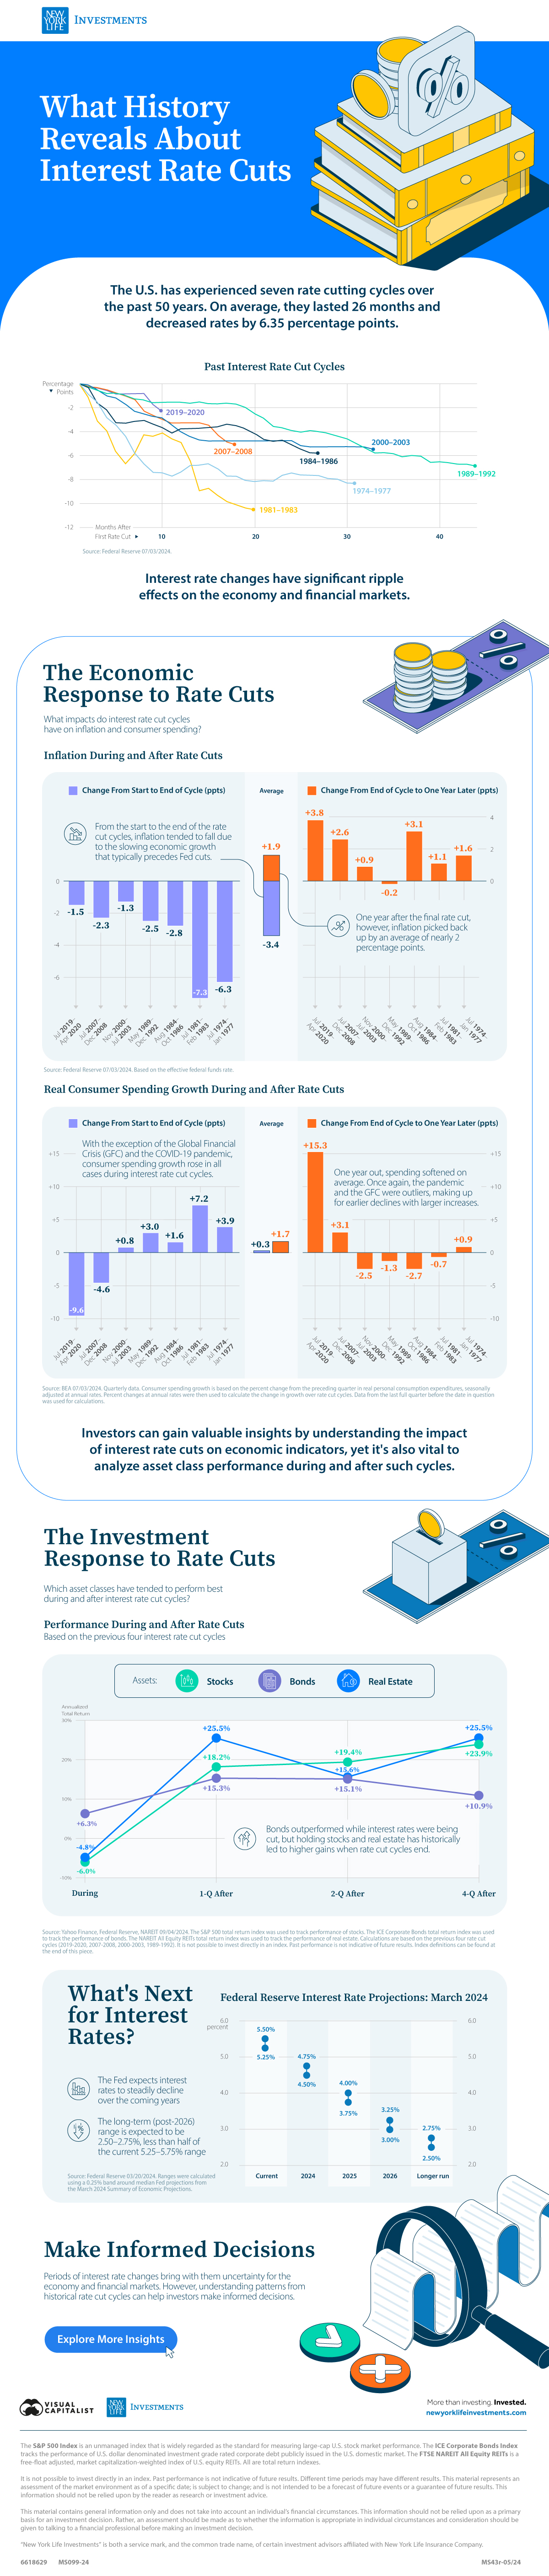
The Federal Reserve has overseen seven cycles of interest rate cuts, averaging 26 months and 6.35 percentage points (ppts) each.
We’ve partnered with New York Life Investments to examine the impact of interest rate cut cycles on the economy and on the performance of financial assets in the U.S. to help keep investors informed.
A Brief History of Interest Rate Cuts
Interest rates are a powerful tool that the central bank can use to spur economic activity.
Typically, when the economy experiences a slowdown or a recession, the Federal Reserve will respond by cutting interest rates. As a result, each of the previous seven rate cut cycles—shown in the table below—occurred during or around U.S. recessions, according to data from the Federal Reserve.
| Interest Rate Cut Cycle | Magnitude (ppts) |
|---|---|
| July 2019–April 2020 | -2.4 |
| July 2007–December 2008 | -5.1 |
| November 2000–July 2003 | -5.5 |
| May 1989–December 1992 | -6.9 |
| August 1984–October 1986 | -5.8 |
| July 1981–February 1983 | -10.5 |
| July 1974–January 1977 | -8.3 |
| Average | -6.4 |
Source: Federal Reserve 07/03/2024
Understanding past economic and financial impacts of interest rate cuts can help investors prepare for future monetary policy changes.
The Economic Response: Inflation
During past cycles, data from the Federal Reserve, shows that, on average, the inflation rate continued to decline throughout (-3.4 percentage points), largely due to the lagged effects of a slower economy that normally precedes interest rate declines.
| Cycle | Start to end change (ppts) | End to one year later (ppts) |
|---|---|---|
| July 2019–April 2020 | -1.5 | +3.8 |
| July 2007–December 2008 | -2.3 | +2.6 |
| November 2000–July 2003 | -1.3 | +0.9 |
| May 1989–December 1992 | -2.5 | -0.2 |
| August 1984–October 1986 | -2.8 | +3.1 |
| July 1981–February 1983 | -7.3 | +1.1 |
| July 1974–January 1977 | -6.3 | +1.6 |
| Average | -3.4 | +1.9 |
Source: Federal Reserve 07/03/2024. Based on the effective federal funds rate. Calculations are based on the previous four rate cut cycles (2019-2020, 2007-2008, 2000-2003, 1989-1992, 1984-1986, 1981-1983, 1974-1977).
However, inflation played catch-up and rose by +1.9 percentage points one year after the final rate cut. With lower interest rates, consumers were incentivized to spend more and save less, which led to an uptick in the price of goods and services in six of the past seven cycles.
The Economic Response: Real Consumer Spending Growth
Real consumer spending growth, as measured by the Bureau of Economic Analysis, typically reacted to rate cuts more quickly.
On average, consumption growth rose slightly during the rate cut periods (+0.3 percentage points) and that increase accelerated one year later (+1.7 percentage points).
| Cycle | Start to end (ppts) | End to one year later (ppts) |
|---|---|---|
| July 2019–April 2020 | -9.6 | +15.3 |
| July 2007–December 2008 | -4.6 | +3.1 |
| November 2000–July 2003 | +0.8 | -2.5 |
| May 1989–December 1992 | +3.0 | -1.3 |
| August 1984–October 1986 | +1.6 | -2.7 |
| July 1981–February 1983 | +7.2 | -0.7 |
| July 1974–January 1977 | +3.9 | +0.9 |
| Average | +0.3 | +1.7 |
Source: BEA 07/03/2024. Quarterly data. Consumer spending growth is based on the percent change from the preceding quarter in real personal consumption expenditures, seasonally adjusted at annual rates. Percent changes at annual rates were then used to calculate the change in growth over rate cut cycles. Data from the last full quarter before the date in question was used for calculations. Calculations are based on the previous four rate cut cycles (2019-2020, 2007-2008, 2000-2003, 1989-1992, 1984-1986, 1981-1983, 1974-1977).
The COVID-19 pandemic and the Global Financial Crisis were outliers. Spending continued to fall during the rate cut cycles but picked up one year later.
The Investment Response: Stocks, Bonds, and Real Estate
Historically, the trend in financial asset performance differed between stocks, bonds, and real estate both during and after interest rate declines.
Stocks and real estate posted negative returns during the cutting phases, with stocks taking the bigger hit. Conversely, bonds, a traditional safe haven, gained ground.
| Asset | During (%) | 1 Quarter After (%) | 2 Quarters After (%) | 4 Quarters After (%) |
|---|---|---|---|---|
| Stocks | -6.0 | +18.2 | +19.4 | +23.9 |
| Bonds | +6.3 | +15.3 | +15.1 | +10.9 |
| Real Estate | -4.8 | +25.5 | +15.6 | +25.5 |
Source: Yahoo Finance, Federal Reserve, NAREIT 09/04/2024. The S&P 500 total return index was used to track performance of stocks. The ICE Corporate Bonds total return index was used to track the performance of bonds. The NAREIT All Equity REITs total return index was used to track the performance of real estate. Calculations are based on the previous four rate cut cycles (2019-2020, 2007-2008, 2000-2003, 1989-1992). It is not possible to invest directly in an index. Past performance is not indicative of future results. Index definitions can be found at the end of this piece.
However, in the quarters preceding the last rate cut, all three assets increased in value. One year later, real estate had the highest average performance, followed closely by stocks, with bonds coming in third.
What’s Next for Interest Rates
In March 2024, the Federal Reserve released its Summary of Economic Projections outlining its expectation that U.S. interest rates will fall steadily in 2024 and beyond.
| Year | Range (%) | Median (%) |
|---|---|---|
| Current | 5.25-5.50 | 5.375 |
| 2024 | 4.50-4.75 | 4.625 |
| 2025 | 3.75-4.0 | 3.875 |
| 2026 | 3.00-3.25 | 3.125 |
| Longer run | 2.50-2.75 | 2.625 |
Source: Federal Reserve 20/03/2024
Though the timing of interest rate cuts is uncertain, being armed with the knowledge of their impact on the economy and financial markets can provide valuable insight to investors.
Explore more insights from New York Life Investments.

-

 Markets3 days ago
Which Retailers Operate in the Most Countries?
From fast-fashion giant H&M to Apple, we show the top retailers globally with the largest international presence.
-

 Maps1 week ago
Mapped: The 10 U.S. States With the Lowest Real GDP Growth
In this graphic, we show where real GDP lagged the most across America in 2023 as high interest rates weighed on state economies.
-

 Venture Capital1 week ago
Ranked: The World’s 50 Largest Private Equity Firms
In this graphic, we show the largest private equity firms in the world—from titan Blackstone to China’s leading alternative funds.
-

 Debt1 week ago
Top 10 Countries Most in Debt to the IMF
Argentina tops the ranking, with a debt equivalent to 5.3% of the country’s GDP.
-

 Markets1 week ago
Ranked: The Top 6 Economies by Share of Global GDP (1980-2024)
Gain a unique perspective on the world’s economic order from this graphic showing % share of global GDP over time.
-

 Economy3 weeks ago
Mapped: Europe’s GDP Per Capita, by Country
Which European economies are richest on a GDP per capita basis? This map shows the results for 44 countries across the continent.

-

 Economy1 week ago
Mapped: The Top Exports in Asian Countries
-

 Maps2 weeks ago
Mapped: U.S. Immigrants by Region
-

 Healthcare2 weeks ago
Which Countries Have the Highest Infant Mortality Rates?
-

 Misc2 weeks ago
Charted: How Americans Feel About Federal Government Agencies
-

 Mining2 weeks ago
Visualizing Copper Production by Country in 2023
-

 Brands2 weeks ago
How Popular Snack Brand Logos Have Changed
-

 War2 weeks ago
Visualized: Aircraft Carriers by Country
-

 United States2 weeks ago
Mapped: Countries Where Recreational Cannabis is Legal