Technical Analysis – USDCAD stuck between converging SMAs
USDCAD extends its rebound to a fresh 1-month high
But does not manage to close above the 50-day SMA
Momentum indicators turn positive
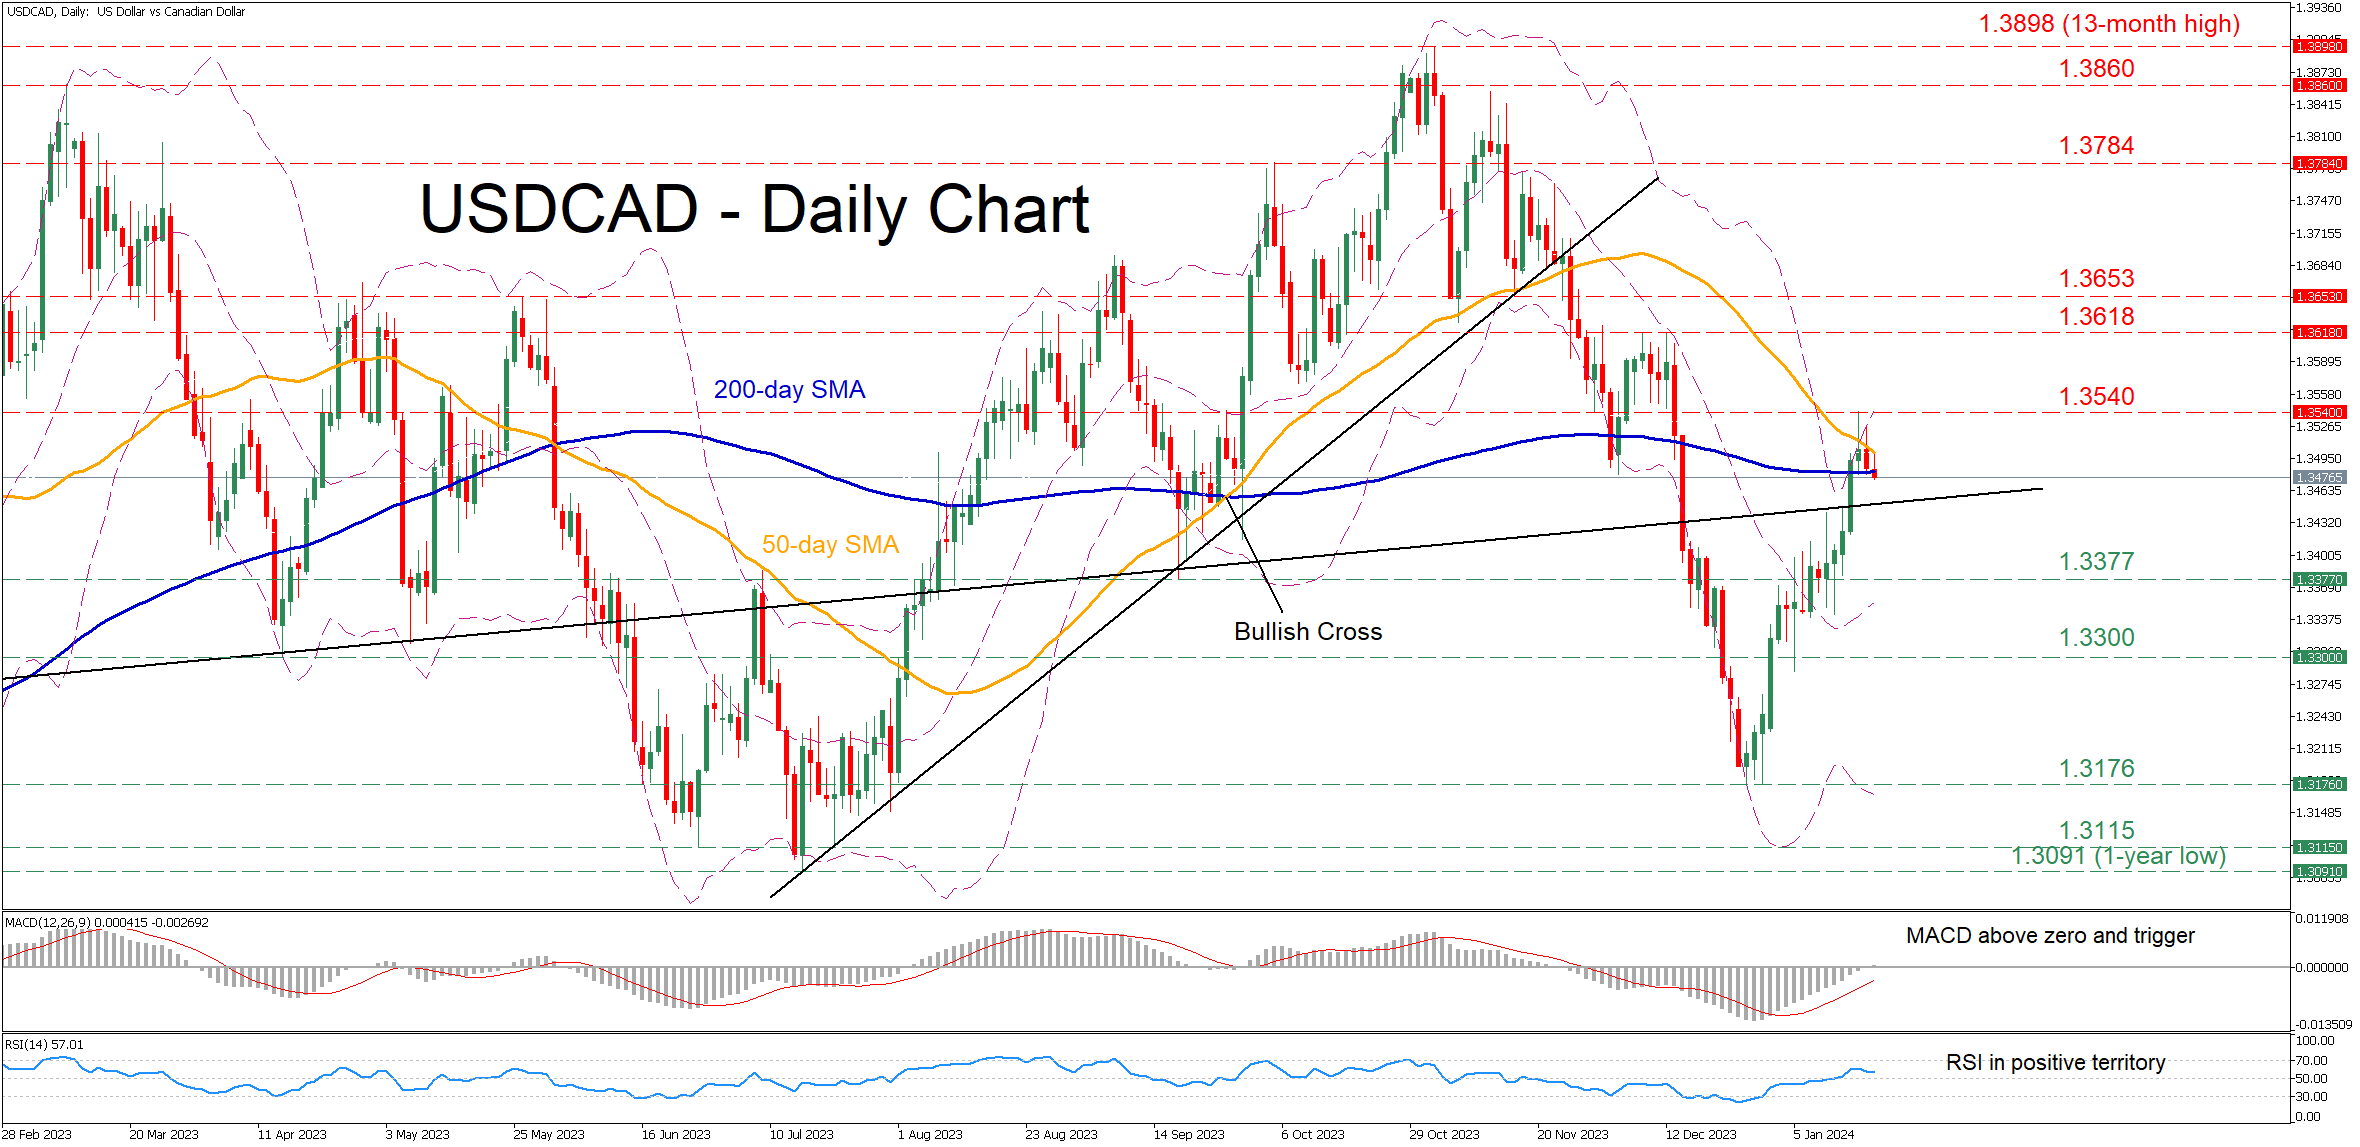
USDCAD had been staging a solid recovery from its December low of 1.3176, but the 50-day simple moving average (SMA) prevented further gains. Despite the rejection, the 200-day SMA has been acting as a strong floor, thus the price is currently hovering between the converging SMAs.
Considering that the MACD has climbed to its positive zone for the first time since late November, the pair could jump above the 50-day SMA and revisit its one-month peak of 1.3540. Conquering that hurdle, the bulls could attack 1.3618, a region that held strong multiple times in December. Further advances may then cease at the April-May resistance of 1.3653.
Alternatively, should the price slide below its 200-day SMA, the September bottom of 1.3377 could be the first barricade for the price to claim. A violation of that territory could open the door for the April bottom of 1.3300. Failing to halt there, the pair could extend its retreat towards the December low of 1.3176..
In brief, USDCAD has been stuck between the converging 50- and 200-day SMAs, while the wide Bollinger bands might suggest heightened volatility moving forward. Therefore, a decisive break above or below the range defined by the SMAs could lead to a significant move in the same direction.
Latest News
Disclaimer: The XM Group entities provide execution-only service and access to our Online Trading Facility, permitting a person to view and/or use the content available on or via the website, is not intended to change or expand on this, nor does it change or expand on this. Such access and use are always subject to: (i) Terms and Conditions; (ii) Risk Warnings; and (iii) Full Disclaimer. Such content is therefore provided as no more than general information. Particularly, please be aware that the contents of our Online Trading Facility are neither a solicitation, nor an offer to enter any transactions on the financial markets. Trading on any financial market involves a significant level of risk to your capital.
All material published on our Online Trading Facility is intended for educational/informational purposes only, and does not contain – nor should it be considered as containing – financial, investment tax or trading advice and recommendations; or a record of our trading prices; or an offer of, or solicitation for, a transaction in any financial instruments; or unsolicited financial promotions to you.
Any third-party content, as well as content prepared by XM, such as: opinions, news, research, analyses, prices and other information or links to third-party sites contained on this website are provided on an “as-is” basis, as general market commentary, and do not constitute investment advice. To the extent that any content is construed as investment research, you must note and accept that the content was not intended to and has not been prepared in accordance with legal requirements designed to promote the independence of investment research and as such, it would be considered as marketing communication under the relevant laws and regulations. Please ensure that you have read and understood our Notification on Non-Independent Investment. Research and Risk Warning concerning the foregoing information, which can be accessed here.