Travel
Charted: Global Tourism Rebounds to Pre-Pandemic Levels
Charted: Global Tourism Rebounds to 2019 Levels
Love them or hate them, tourists are back.
Global tourism has rebounded to pre-pandemic levels according to data sourced from the International Monetary Fund’s World Economic Report (2023)
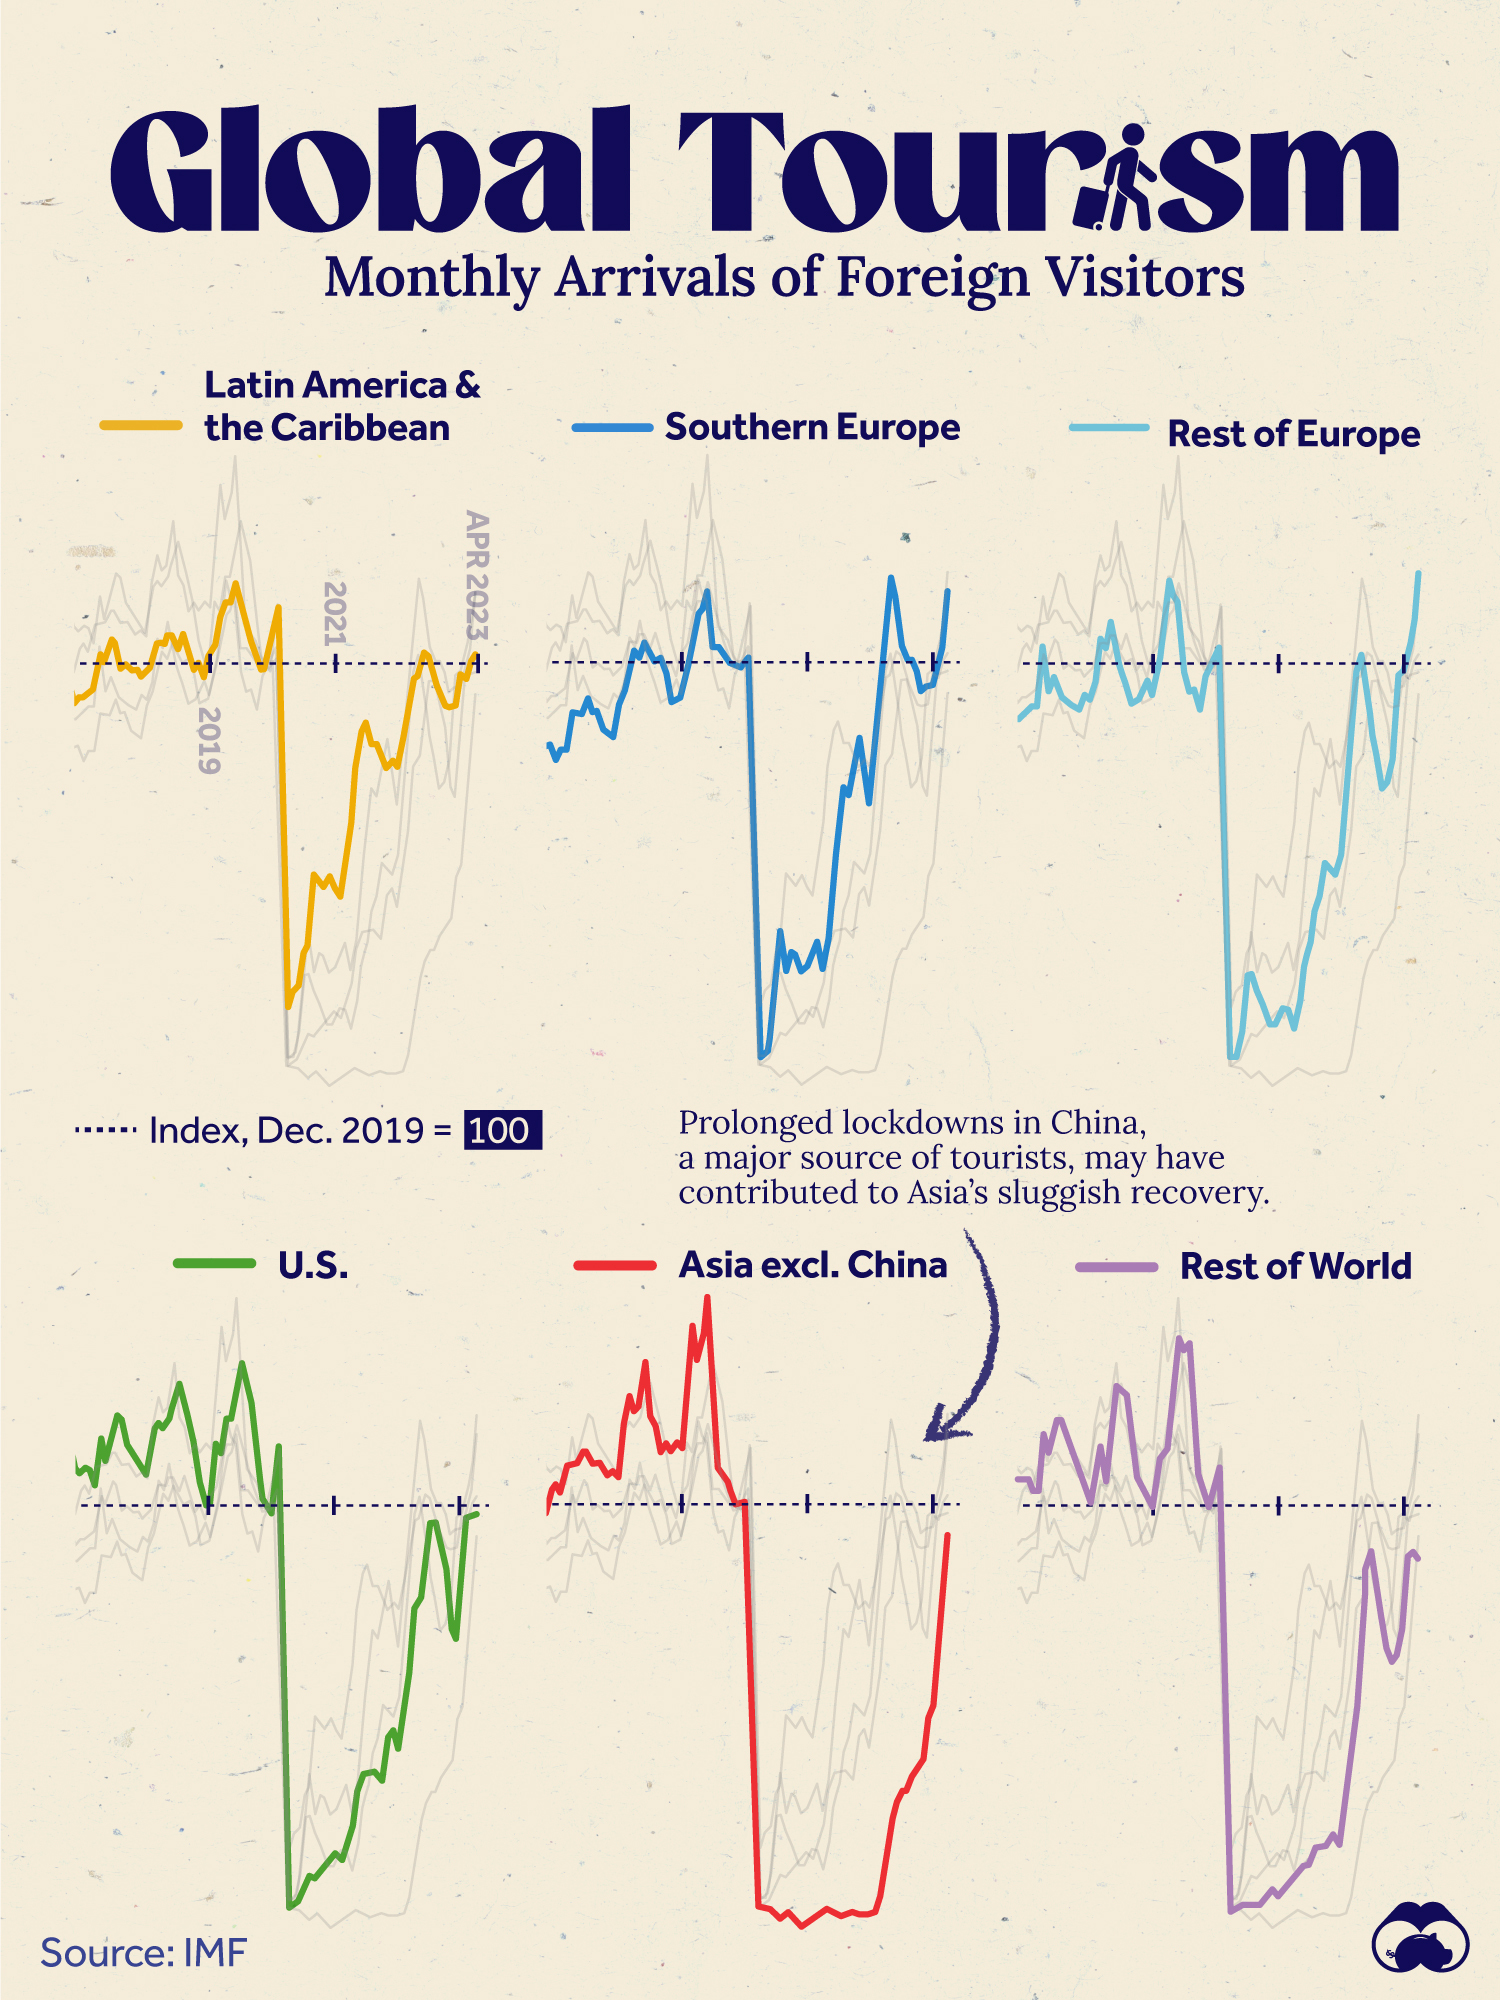
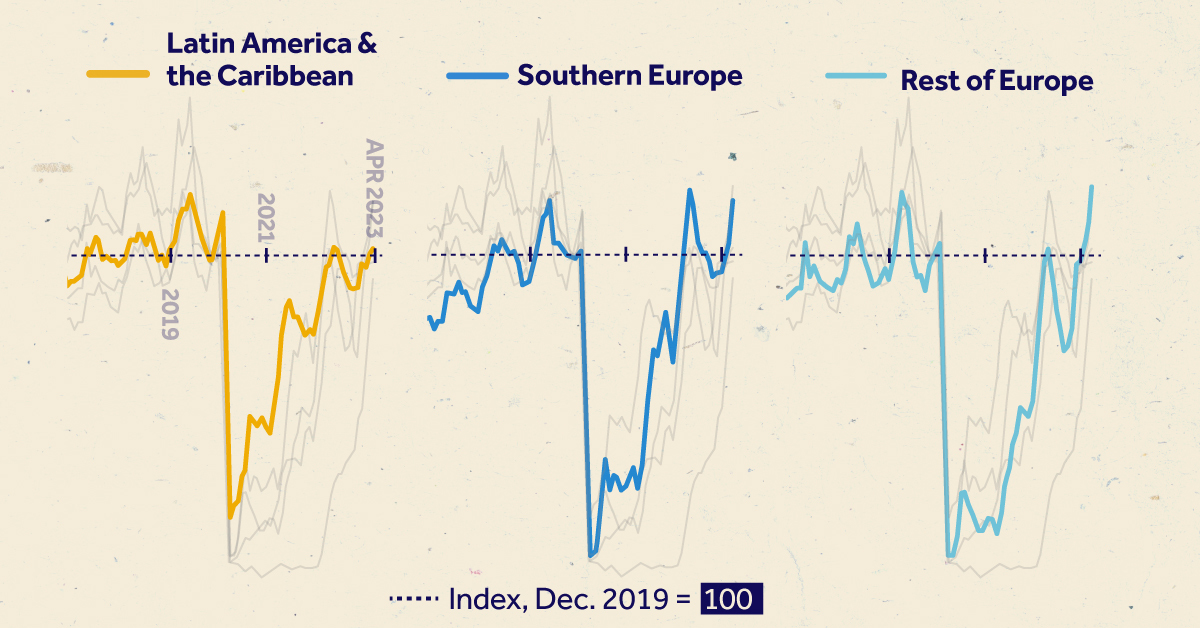
We visualize monthly arrivals of foreign visitors to various regions, indexed to December 2019 levels.
Europe Leads as Destination for Resurging Tourism
Having been the first industry to suffer almost immediately from COVID-19 required lockdowns and border closures, global tourism has been on a steady recovery in the last year and a half.
In fact, Europe was the first region to get back to pre-pandemic levels in April–May 2022, with the U.S. nearly approaching the mark in July that same year.
In the tables below we showcase the relative scale of monthly arrivals of foreign visitors to various regions, indexed to Dec 2019 levels. Figures below 100 mean there were fewer foreign arrivals than December 2019, and vice-versa.
| Year/Month | Southern Europe | Rest of Europe | U.S. |
|---|---|---|---|
| Dec 2015 | 72.4 | 82.2 | 111.1 |
| Dec 2016 | 80.5 | 87.0 | 107.9 |
| Dec 2017 | 82.7 | 92.6 | 108.8 |
| Dec 2018 | 91.8 | 96.0 | 100.6 |
| Dec 2019 | 100.0 | 100.0 | 100.0 |
| Dec 2020 | 26.4 | 13.7 | 15.9 |
| Dec 2021 | 73.6 | 50.1 | 46.9 |
| Dec 2022 | 95.2 | 97.1 | 68.1 |
| April 2023 | 117.2 | 121.8 | 97.8 |
Latin America also hit pre-pandemic levels of tourists in June 2022 and then again in April 2023.
One major exception to the recovery is Asia (excluding China), which was at 90.8% of 2019 levels as of April 2023. As it happens, the lack of Chinese tourists—due to China’s prolonged period of COVID-19 lockdowns—are likely a major factor for Asia’s slower tourism recovery.
| Year/Month | Latin America & the Caribbean | Asia (ex-China) | Rest of World |
|---|---|---|---|
| Dec 2015 | 82.9 | 98.1 | 101.7 |
| Dec 2016 | 92.1 | 103.3 | 105.5 |
| Dec 2017 | 97.4 | 108.1 | 104.5 |
| Dec 2018 | 97.1 | 115.0 | 102.7 |
| Dec 2019 | 100.0 | 100.0 | 100.0 |
| Dec 2020 | 49.3 | -0.4 | 8.1 |
| Dec 2021 | 76.9 | 2.2 | 21.0 |
| Dec 2022 | 90.3 | 49.2 | 64.4 |
| April 2023 | 102.5 | 90.8 | 86.6 |
Rising Chinese income levels has made the country the world’s largest source of tourists. For example, in 2019 (pre-COVID), China ranked first in terms of outbound tourism spending, at $255 billion.
Airlines Passenger Share Mirrors Tourism Trends
Consequently, the airline industry of these regions has also seen correlating gains and losses in traffic. European airlines had the highest share of passenger traffic, followed by the U.S. in 2022. At the same time all four of China’s largest airlines saw a fall in traffic.
Meanwhile the outlook on the Chinese economy (second largest in the world) remains uncertain at best, which is casting a pall on global growth prospects for the next year.


Automotive
How People Get Around in America, Europe, and Asia
Examining how people get around using cars, public transit, and walking or biking, and the regional differences in usage.


How People Get Around in America, Europe, and Asia
This was originally posted on our Voronoi app. Download the app for free on iOS or Android and discover incredible data-driven charts from a variety of trusted sources.
This chart highlights the popularity of different transportation types in the Americas, Europe, and Asia, calculated by modal share.
Data for this article and visualization is sourced from ‘The ABC of Mobility’, a research paper by Rafael Prieto-Curiel (Complexity Science Hub) and Juan P. Ospina (EAFIT University), accessed through ScienceDirect.
The authors gathered their modal share data through travel surveys, which focused on the primary mode of transportation a person employs for each weekday trip. Information from 800 cities across 61 countries was collected for this study.
North American Car Culture Contrasts with the Rest of the World
In the U.S. and Canada, people heavily rely on cars to get around, no matter the size of the city. There are a few exceptions of course, such as New York, Toronto, and smaller college towns across the United States.
| Region | 🚗 Cars | 🚌 Public Transport | 🚶 Walking/Biking |
|---|---|---|---|
| North America* | 92% | 5% | 4% |
| Central America | 23% | 42% | 35% |
| South America | 29% | 40% | 31% |
| Northern Europe | 48% | 29% | 24% |
| Western Europe | 43% | 24% | 34% |
| Southern Europe | 50% | 24% | 25% |
| Eastern Europe | 35% | 40% | 25% |
| Southeastern Asia | 44% | 43% | 13% |
| Western Asia | 43% | 28% | 29% |
| Southern Asia | 22% | 39% | 39% |
| Eastern Asia | 19% | 46% | 35% |
| World | 51% | 26% | 22% |
Note: *Excluding Mexico. Percentages are rounded.
As a result, North America’s share of public transport and active mobility (walking and biking) is the lowest amongst all surveyed regions by a significant amount.
On the other hand, public transport reigns supreme in South and Central America as well as Southern and Eastern Asia. It ties with cars in Southeastern Asia, and is eclipsed by cars in Western Asia.
As outlined in the paper, Europe sees more city-level differences in transport popularity.
For example, Utrecht, Netherlands prefers walking and biking. People in Paris and London like using their extensive transit systems. And in Manchester and Rome, roughly two out of three journeys are by car.

-

 Healthcare2 weeks ago
Which Countries Have the Highest Infant Mortality Rates?
-

 Misc1 week ago
Visualizing Global Losses from Financial Scams
-

 population1 week ago
Mapped: U.S. States By Number of Cities Over 250,000 Residents
-

 Culture1 week ago
Charted: How the Logos of Select Fashion Brands Have Evolved
-

 United States1 week ago
Mapped: Countries Where Recreational Cannabis is Legal
-

 Misc1 week ago
Visualized: Aircraft Carriers by Country
-

 Culture2 weeks ago
How Popular Snack Brand Logos Have Changed
-

 Mining2 weeks ago
Visualizing Copper Production by Country in 2023