Markets
Visualizing U.S. GDP by Industry in 2023
Visualizing U.S. GDP by Industry
The U.S. economy is like a giant machine driven by many different industries, each one akin to an essential cog that moves the whole.
Understanding the breakdown of national gross domestic product (GDP) by industry shows where commercial activity is bustling and how diverse the economy truly is.
The above infographic uses data from the Bureau of Economic Analysis to visualize a breakdown of U.S. GDP by industry in 2023. To show this, we use value added by industry, which reflects the difference between gross output and the cost of intermediate inputs.
The Top 10 U.S. Industries by GDP
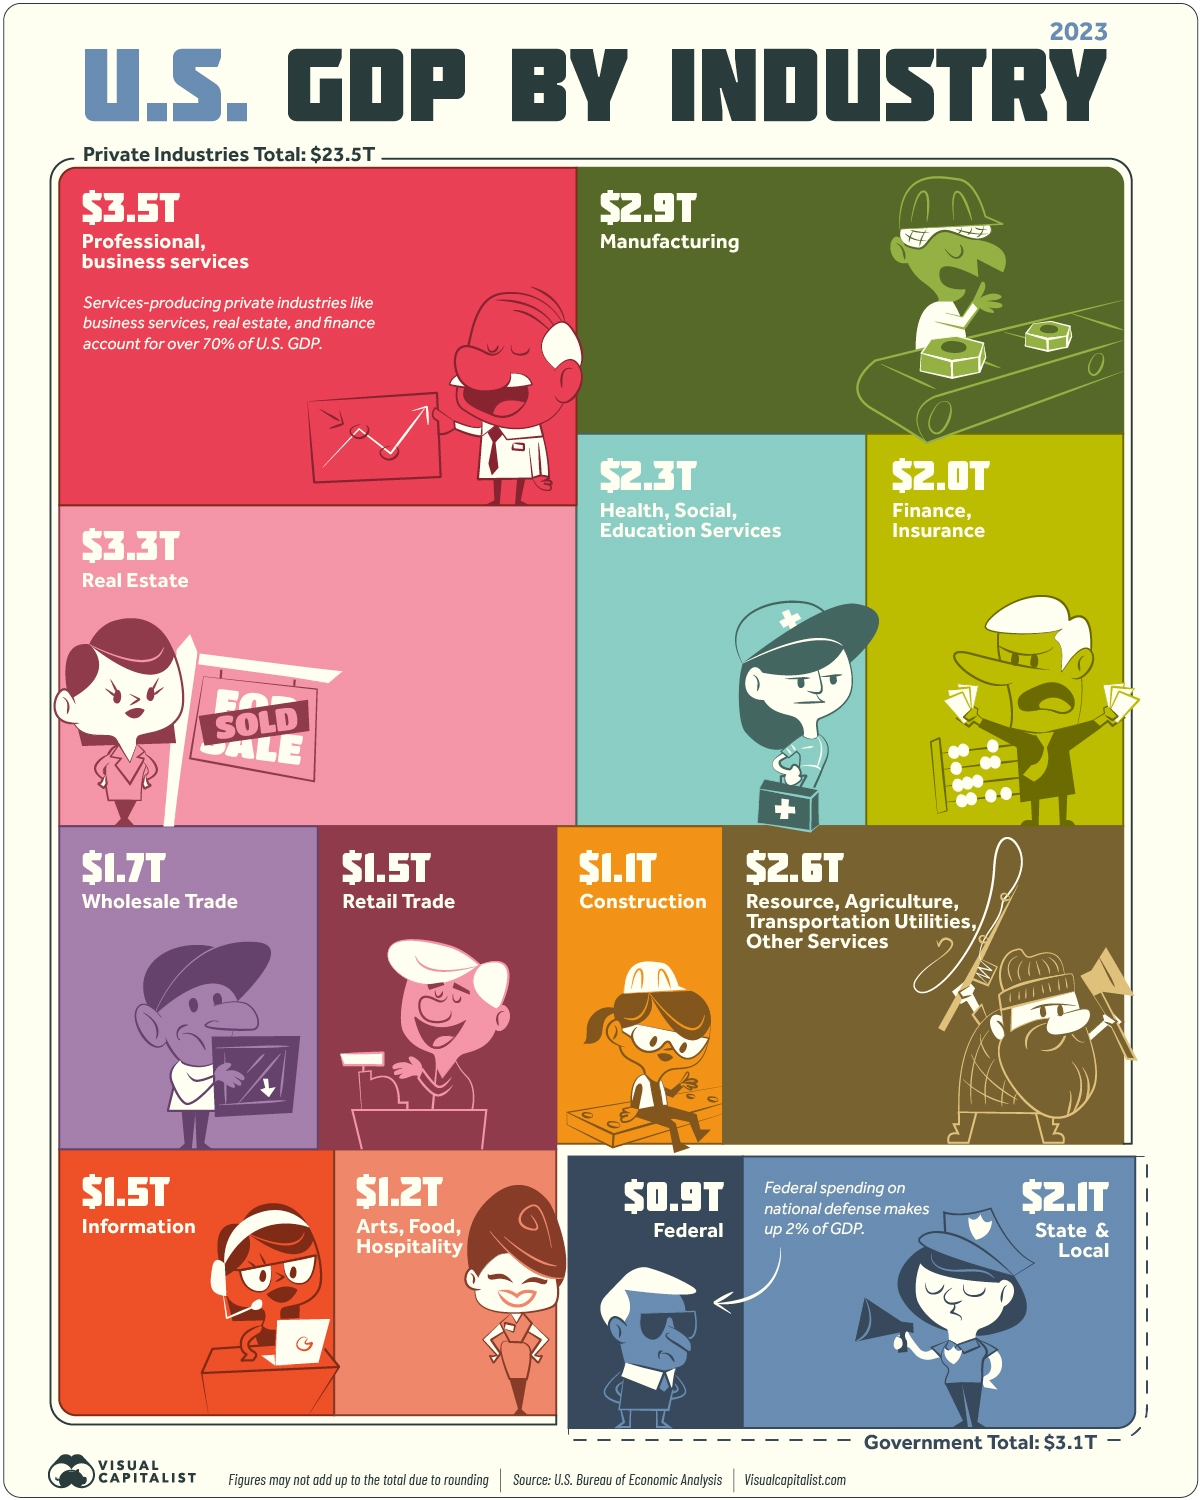
As of Q1 2023, the annualized GDP of the U.S. sits at $26.5 trillion.
Of this, 88% or $23.5 trillion comes from private industries. The remaining $3 trillion is government spending at the federal, state, and local levels.
Here’s a look at the largest private industries by economic contribution in the United States:
| Industry | Annualized Nominal GDP (as of Q1 2023) | % of U.S. GDP |
|---|---|---|
| Professional and business services | $3.5T | 13% |
| Real estate, rental, and leasing | $3.3T | 12% |
| Manufacturing | $2.9T | 11% |
| Educational services, health care, and social assistance | $2.3T | 9% |
| Finance and insurance | $2.0T | 8% |
| Wholesale trade | $1.7T | 6% |
| Retail trade | $1.5T | 6% |
| Information | $1.5T | 6% |
| Arts, entertainment, recreation, accommodation, and food services | $1.2T | 4% |
| Construction | $1.1T | 4% |
| Other private industries | $2.6T | 10% |
| Total | $23.5T | 88% |
Like most other developed nations, the U.S. economy is largely based on services.
Service-based industries, including professional and business services, real estate, finance, and health care, make up the bulk (70%) of U.S. GDP. In comparison, goods-producing industries like agriculture, manufacturing, mining, and construction play a smaller role.
Professional and business services is the largest industry with $3.5 trillion in value added. It comprises establishments providing legal, consulting, design, administration, and other services. This is followed by real estate at $3.3 trillion, which has consistently been an integral part of the economy.
Due to outsourcing and other factors, the manufacturing industry’s share of GDP has been declining for decades, but it still remains a significant part of the economy. Manufacturing of durable goods (metals, machines, computers) accounts for $1.6 trillion in value added, alongside nondurable goods (food, petroleum, chemicals) at $1.3 trillion.
The Government’s Contribution to GDP
Just like private industries, the government’s value added to GDP consists of compensation of employees, taxes collected (less subsidies), and gross operating surplus.
| Government | Annualized Nominal GDP (as of Q1 2023) | % of U.S. GDP |
|---|---|---|
| State and Local | $2.1T | 8% |
| Federal | $0.9T | 4% |
| Total | $3.1T | 12% |
Figures may not add up to the total due to rounding.
State and local government spending, largely focused on the education and public welfare sectors, accounts for the bulk of value added. The Federal contribution to GDP amounts to roughly $948 billion, with 52% of it attributed to national defense.
The Fastest Growing Industries (2022–2032P)
In the next 10 years, services-producing industries are projected to see the fastest growth in output.
The table below shows the five fastest-growing industries in the U.S. from 2022–2032 in terms of total output, based on data from the Bureau of Labor Statistics:
| Industry | Sector | Compound Annual Rate of Output Growth (2022–2032P) |
|---|---|---|
| Software publishers | Information | 5.2% |
| Computing infrastructure providers, data processing, and related services | Information | 3.9% |
| Wireless telecommunications carriers (except satellite) | Information | 3.6% |
| Home health care services | Health care and social assistance | 3.6% |
| Oil and gas extraction | Mining | 3.5% |
Three of the fastest-growing industries are in the information sector, underscoring the growing role of technology and digital infrastructure. Meanwhile, the projected growth of the oil and gas extraction industry highlights the enduring demand for traditional energy sources, despite the energy transition.
Overall, the development of these industries suggests that the U.S. will continue its shift toward a services-oriented economy. But today, it’s also worth noticing how services- and goods-producing industries are increasingly tied together. For example, it’s now common for tech companies to produce devices, and for manufacturers to use software in their operations.
Therefore, the oncoming tide of growth in service-based industries could potentially lift other interconnected sectors of the diverse U.S. economy.


Markets
Which Retailers Operate in the Most Countries?
From fast-fashion giant H&M to Apple, we show the top retailers globally with the largest international presence.
The Top Retailers Operating in the Most Countries
This was originally posted on our Voronoi app. Download the app for free on iOS or Android and discover incredible data-driven charts from a variety of trusted sources.
Today, international expansion is a key growth strategy for the world’s top retailers as companies target untapped markets with the highest potential to drive revenue and profit streams.
While traditional retailers have sought out digital strategies as the industry evolves and consumer behaviors change, physical storefronts continue to be a dominant driver of retail sales. In 2023, brick-and-mortar sales comprised 81% of retail sales globally.
This graphic shows the top retailers operating in the most markets worldwide, based on data from the National Retail Federation.
Global Retailers With the Largest International Footprint
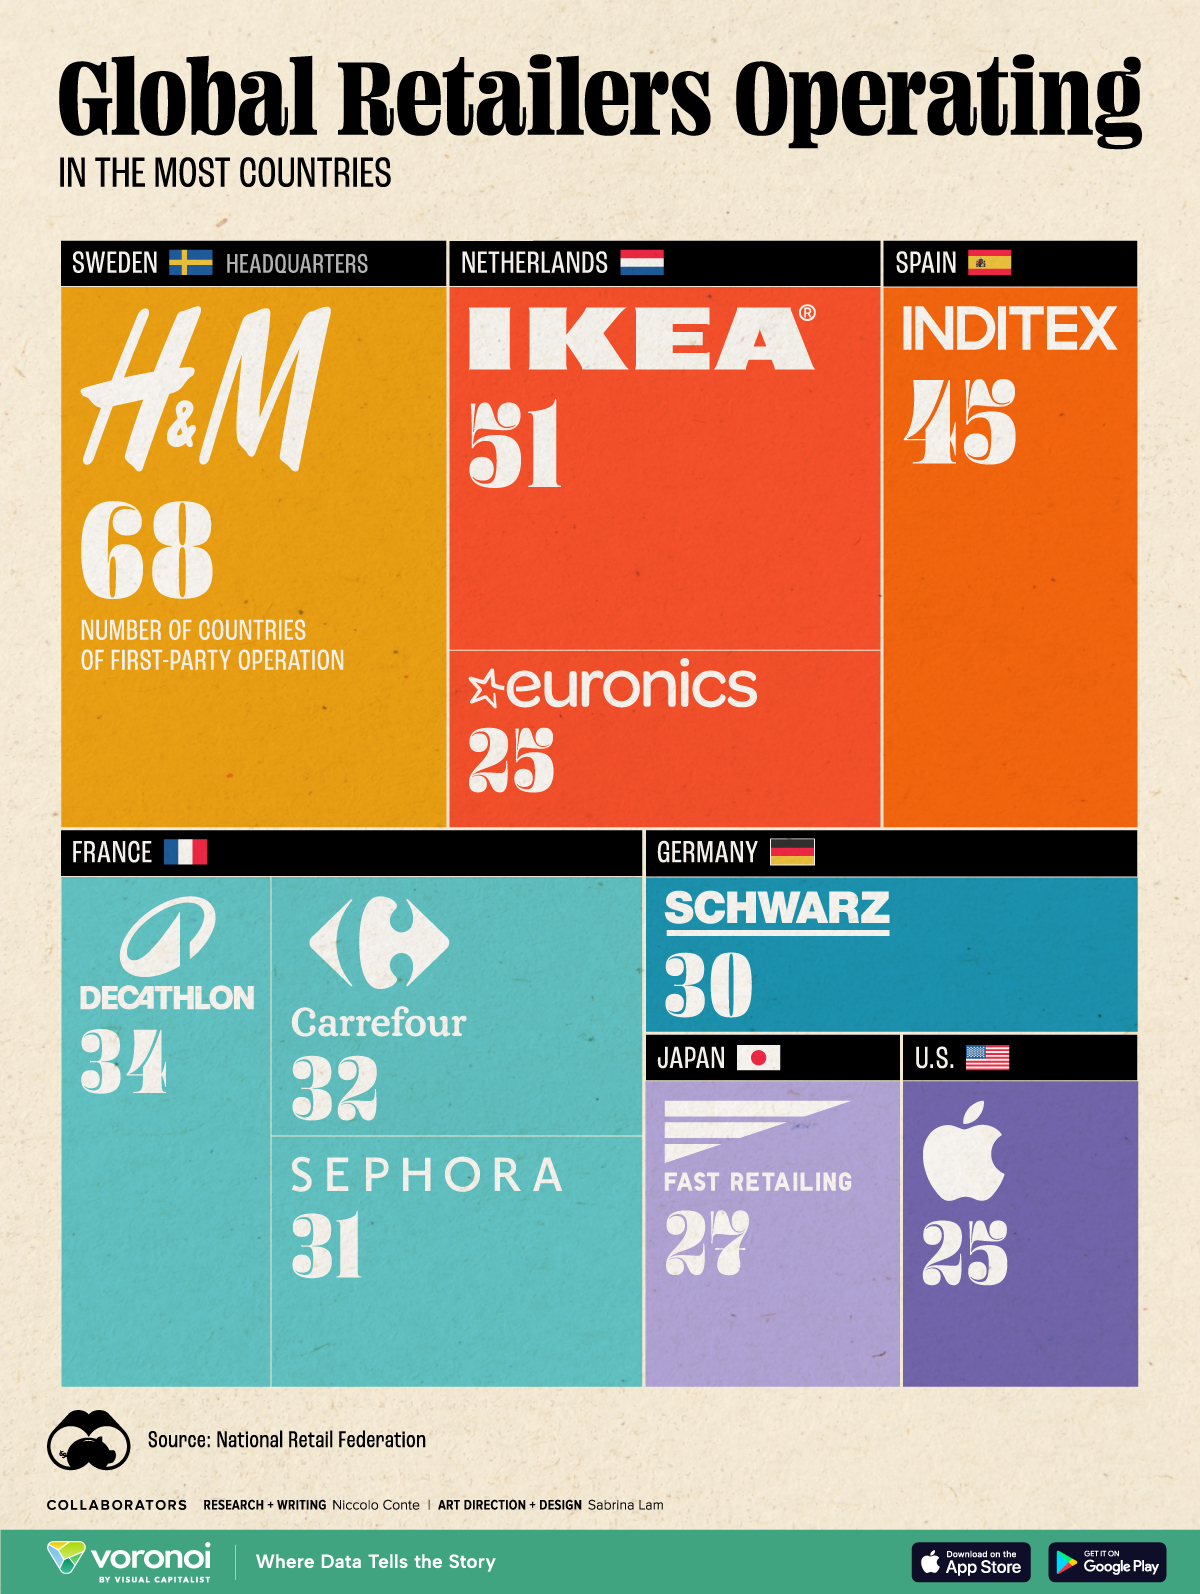
Here are the global retailers with the widest-reaching presence around the world in 2023:
| Ranking | Retailer | Number of Countries of First-Party Operation | Headquarters |
|---|---|---|---|
| 1 | H&M | 68 | 🇸🇪 Sweden |
| 2 | IKEA | 51 | 🇳🇱 Netherlands |
| 3 | Inditex | 45 | 🇪🇸 Spain |
| 4 | Decathlon | 34 | 🇫🇷 France |
| 5 | Carrefour | 32 | 🇫🇷 France |
| 6 | Sephora (LVMH) | 31 | 🇫🇷 France |
| 7 | Schwarz Group | 30 | 🇩🇪 Germany |
| 8 | Fast Retailing | 27 | 🇯🇵 Japan |
| 9 | Euronics International | 25 | 🇳🇱 Netherlands |
| 10 | Apple | 25 | 🇺🇸 U.S. |
Notably, eight of the top 10 companies with the widest market reach hail from Europe.
Fast-fashion giant H&M ranks first overall, with 4,454 stores across 68 countries last year. In 2023, the Swedish company earned $21.6 billion in revenues, with its largest markets by number of store locations being the U.S., Germany, and the UK. This year, it plans to open 100 new stores in growth markets, along with shutting down 160 stores in established locations, ultimately decreasing its global store count.
In second is IKEA, with a presence in 51 countries. Last year, the company expanded its footprint in India, launching its first store in the tech hub, Hyderabad. While the company has a broad international reach, its number of storefronts is a fraction of H&M, at 477 total stores worldwide.
Looking beyond the continent, Japan’s Fast Retailing is the top retailer in Asia, operating in 27 countries globally. As the parent company to fashion brand Uniqlo, it also stands as the seventh most valuable listed firm by market capitalization in the country.
Additionally, Apple is the sole American company to make this list, with storefronts in 25 countries. Overall, the company operates four types of retail stores: regular, AppleStore+, flagships, and flagship+. Regular stores often earn $40 million annually, while flagship+ stores typically earn more than $100 million.
By 2027, the company plans to build or remodel 53 stores globally, with the majority located in the U.S. and China.

-

 Healthcare2 weeks ago
Which Countries Have the Highest Infant Mortality Rates?
-

 Misc1 week ago
Visualizing Global Losses from Financial Scams
-

 population1 week ago
Mapped: U.S. States By Number of Cities Over 250,000 Residents
-

 Business1 week ago
Charted: How the Logos of Select Fashion Brands Have Evolved
-

 United States1 week ago
Mapped: Countries Where Recreational Cannabis is Legal
-

 War2 weeks ago
Visualized: Aircraft Carriers by Country
-

 Culture2 weeks ago
How Popular Snack Brand Logos Have Changed
-

 Mining2 weeks ago
Visualizing Copper Production by Country in 2023