Economy
Charted: Comparing the GDP of BRICS and the G7 Countries
Comparing the GDP of BRICS and the G7: Visualized
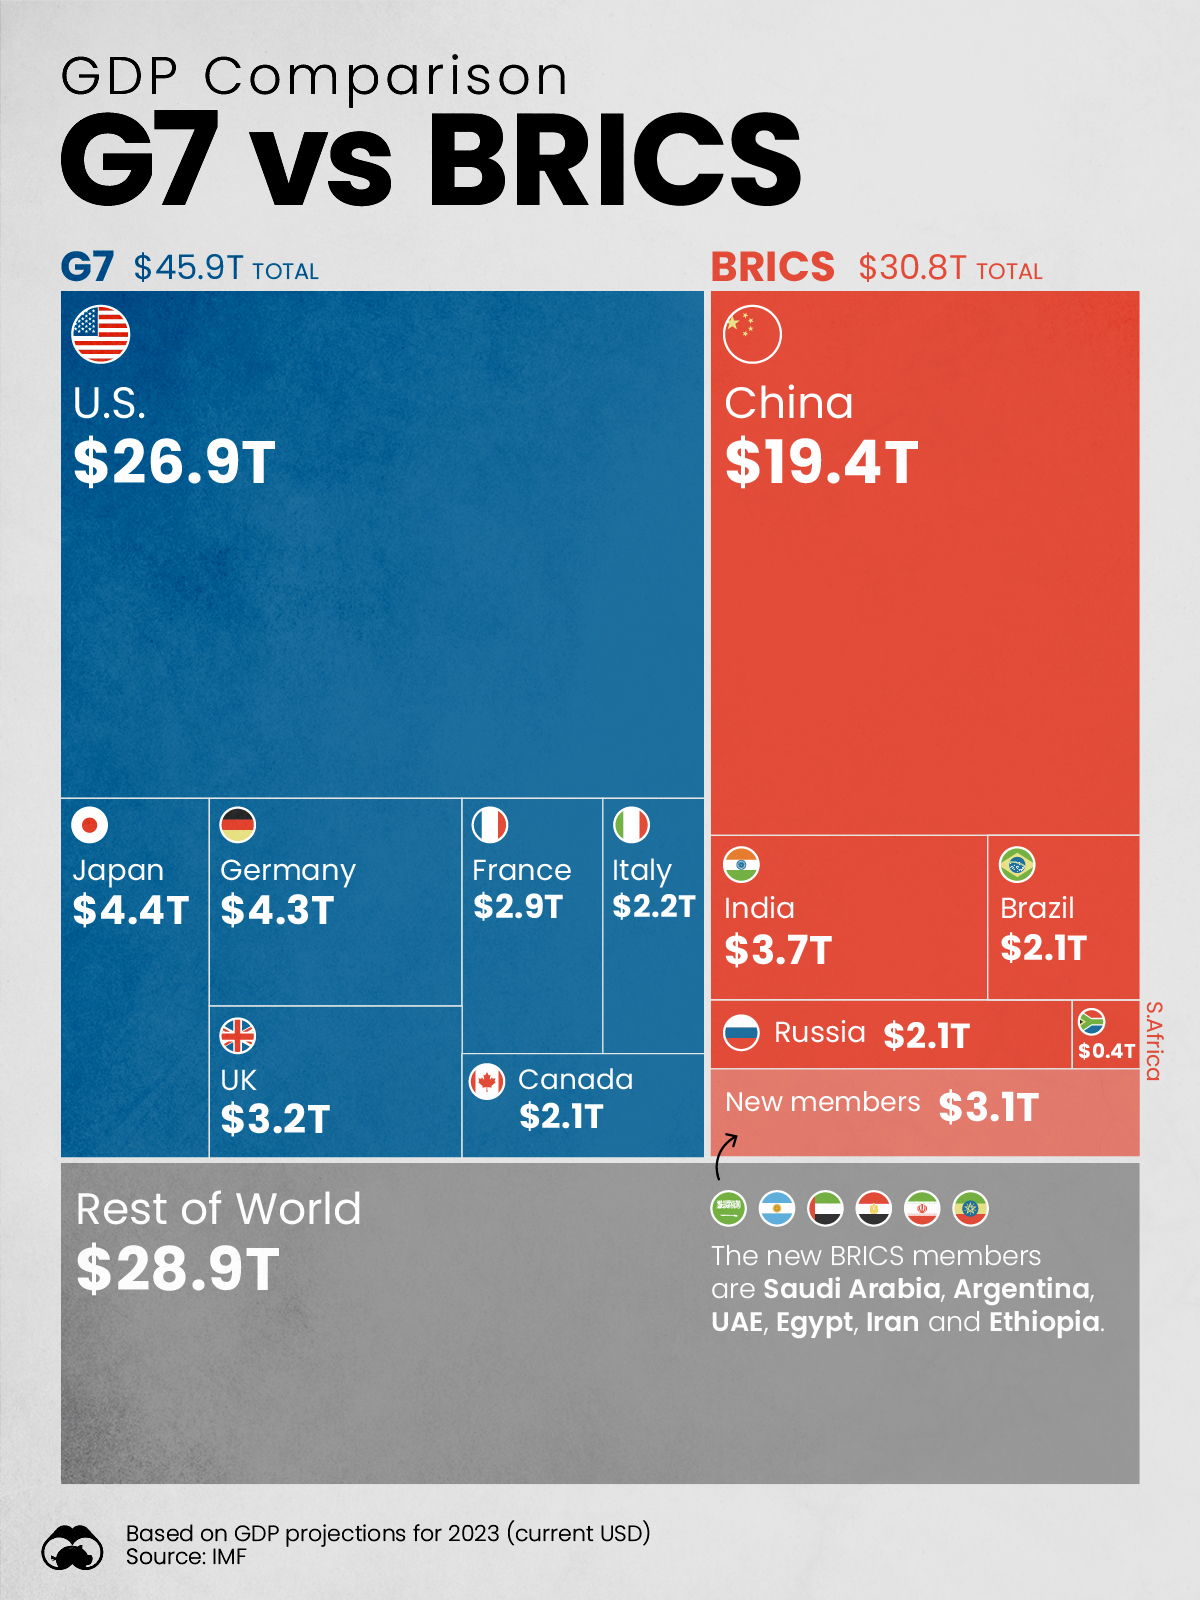
BRICS is set to add six new member states at the start of 2024, raising questions about the expansion of the group’s growing economic power. With its new entrants, the bloc will represent over $30 trillion in GDP or around 29% of the world’s GDP.
This graphic compares the GDP of BRICS nations to the G7 by using GDP projections for 2023 from the International Monetary Fund (IMF).
Even with its new members, BRICS falls short of the G7’s 43% share of global GDP. However, the gap is likely to shrink as major BRICS nations such as India continue to grow at above-average rates—and as the group likely welcomes even more members in the future.
How Does BRICS Compare to the G7 with its New Members?
Prior to the addition of its new members (Argentina, Egypt, Ethiopia, Iran, Saudi Arabia, and the UAE), BRICS had a cumulative GDP of $27.7 trillion, a 26% share of global GDP. BRICS’ new members add $3.1 trillion of GDP to the bloc, with Saudi Arabia contributing the most thanks to its GDP of $1.1 trillion.
In the tables below, you can see how new members affect the bloc’s GDP, and how the BRICS compare to G7 countries.
| BRICS Countries | 2023 GDP (USD billions) | Share of Global GDP |
|---|---|---|
| 🇨🇳 China | $19,374 | 18% |
| 🇮🇳 India | $3,737 | 4% |
| 🇧🇷 Brazil | $2,081 | 2% |
| 🇷🇺 Russia | $2,063 | 2% |
| 🇿🇦 South Africa | $399 | 0.4% |
| 🇸🇦 Saudi Arabia* | $1,062 | 1% |
| 🇦🇷 Argentina* | $641 | 0.6% |
| 🇦🇪 UAE* | $499 | 0.5% |
| 🇪🇬 Egypt* | $387 | 0.4% |
| 🇮🇷 Iran* | $368 | 0.4% |
| 🇪🇹 Ethiopia* | $156 | 0.2% |
| BRICS Total | $30,767 | 29% |
*New additions to BRICS that will join bloc on January 2024
Source: IMF
| G7 Countries | 2023 GDP (USD billions) | Share of Global GDP |
|---|---|---|
| 🇺🇸 U.S. | $26,855 | 25% |
| 🇯🇵 Japan | $4,410 | 4% |
| 🇩🇪 Germany | $4,309 | 4% |
| 🇬🇧 UK | $3,159 | 3% |
| 🇫🇷 France | $2,923 | 3% |
| 🇮🇹 Italy | $2,170 | 2% |
| 🇨🇦 Canada | $2,090 | 2% |
| G7 Total | $45,916 | 43% |
Source: IMF
Even with its new members, BRICS still falls short of the G7’s $45.9 trillion in GDP, however, the new members do add other contributions besides raw GDP to the bloc.
With the addition of Saudi Arabia, the UAE, and Iran, BRICS more than doubles its members’ share of global oil production to 43%. Along with petroleum, Argentina’s addition to BRICS significantly expands the total lithium reserves of the group, which will be key as global battery production and EV adoption continue to grow.
As BRICS seems set to create an alternate trade and financial system that operates independently from the U.S. dollar, adding nations with more natural resources is essential.
Future Economic Growth of BRICS vs. G7 Nations
While the new BRICS members don’t have too big of a GDP contribution to the bloc currently, it’s worth noting that many of the new entrants have significant growth ahead of them.
Many of BRICS’ current members already have real GDP growth rates that are higher than their G7 counterparts, with current members having an average GDP growth of 189% to 2050 compared to the G7’s average of 50%, according to Goldman Sachs.
BRICS’ newly added members like Ethiopia (1,170% GDP growth projected by 2050) and Egypt (635% GDP growth projected by 2050) have even higher rates of potential economic growth, further raising the bloc’s economic potential.
Goldman Sachs forecasts indicate that by 2050, BRICS will have overtaken the G7 in terms of GDP, even without its newly added members. Whether or not these projections pan out is yet to be determined, however with BRICS intent on adding even more members, the group is likely to eclipse the G7’s GDP in the coming decades.


Public Opinion
Charted: How Americans Feel About Federal Government Agencies
Fourteen of 16 federal government agencies garnered more favorable responses than unfavorable ones. But what were the outliers?
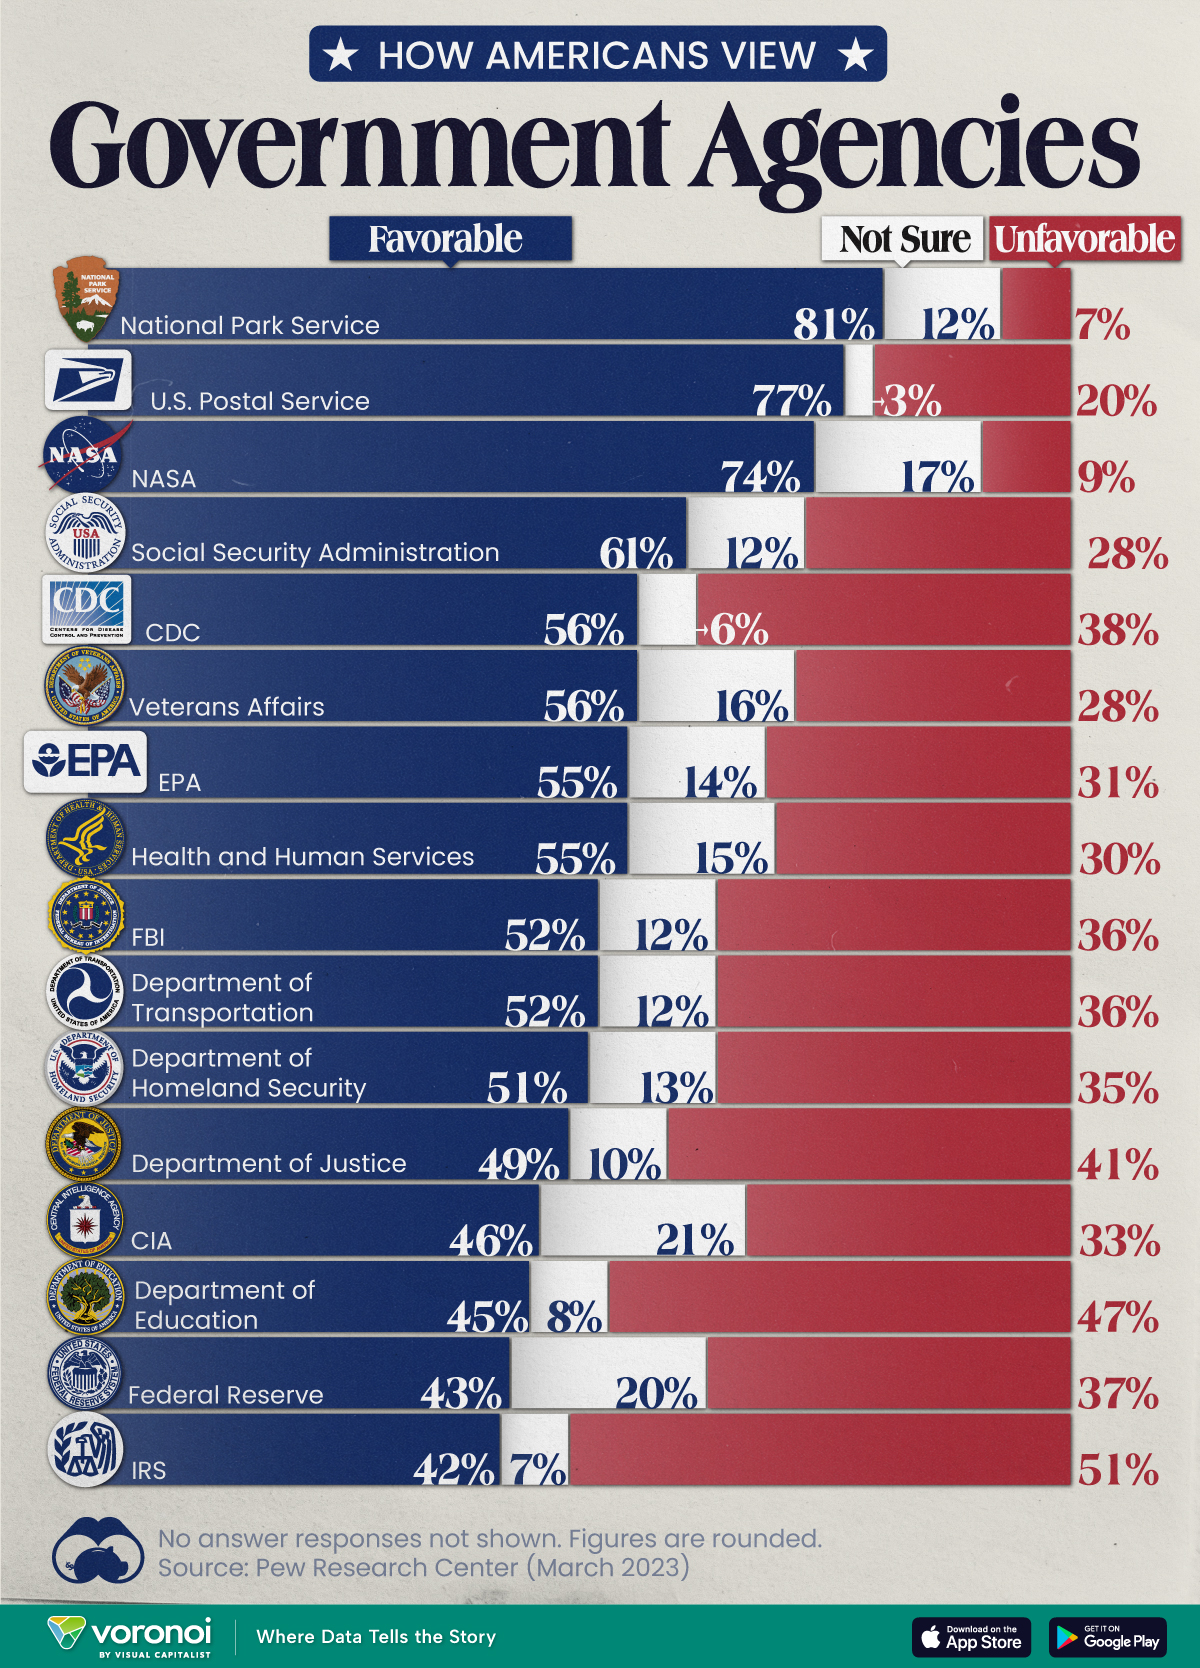

Chart: How Americans Rate 16 Federal Government Agencies
This was originally posted on our Voronoi app. Download the app for free on iOS or Android and discover incredible data-driven charts from a variety of trusted sources.
Come election time, America won’t hesitate to show its approval or disapproval of the country’s elected political representatives. That said, feelings about the federal bureaucracy and its associated agencies are a little harder to gauge.
We chart the results from an opinion poll conducted by Pew Research Center between March 13-19, 2023. In it, 10,701 adults—a representative of the U.S. adult population—were asked whether they felt favorably or unfavorably towards 16 different federal government agencies.
Americans Love the Park Service, Are Divided Over the IRS
Broadly speaking, 14 of the 16 federal government agencies garnered more favorable responses than unfavorable ones.
Of them, the Parks Service, Postal Service, and NASA all had the approval of more than 70% of the respondents.
| Agency | Favorable | Unfavorable | Not sure |
|---|---|---|---|
| 🏞️ National Park Service | 81% | 7% | 12% |
| 📮 U.S. Postal Service | 77% | 20% | 3% |
| 🚀 NASA | 74% | 9% | 17% |
| 💼 Social Security Administration | 61% | 28% | 12% |
| 🔬 CDC | 56% | 38% | 6% |
| 🎖️ Veterans Affairs | 56% | 28% | 16% |
| 🌿 EPA | 55% | 31% | 14% |
| 💉 Health & Human Services | 55% | 30% | 15% |
| 🕵️ FBI | 52% | 36% | 12% |
| 🚗 Department of Transportation | 52% | 36% | 12% |
| 🛡️ Department of Homeland Security | 51% | 35% | 13% |
| ⚖️ Department of Justice | 49% | 41% | 10% |
| 🕵️♂️ CIA | 46% | 33% | 21% |
| 📚 Department of Education | 45% | 47% | 8% |
| 💰 Federal Reserve | 43% | 37% | 20% |
| 💼 IRS | 42% | 51% | 7% |
Note: Figures are rounded. No answer responses are not shown.
Only the Department of Education and the IRS earned more unfavorable responses, and between them, only the IRS had a majority (51%) of unfavorable responses.
There are some caveats to remember with this data. Firstly, tax collection is a less-friendly activity than say, maintaining picturesque parks. Secondly, the survey was conducted a month before taxes were typically due, a peak time for experiencing filing woes.
Nevertheless, the IRS has come under fire in recent years. As per a New York Times article in 2019, eight years of budget cuts have stymied the agency’s ability to scrutinize tax filings from wealthier and more sophisticated filers.
At the same time poorer Americans are facing increasing audits on wage subsidies available to low income workers. According to a Transactional Records Access Clearinghouse report, this subset of filers was audited five-and-a-half more times the average American.

-

 Technology5 days ago
Mapped: The Number of AI Startups By Country
-

 Jobs2 weeks ago
The Best U.S. Companies to Work for According to LinkedIn
-

 Economy2 weeks ago
Ranked: The Top 20 Countries in Debt to China
-

 Politics2 weeks ago
Charted: Trust in Government Institutions by G7 Countries
-

 Energy2 weeks ago
Mapped: The Age of Energy Projects in Interconnection Queues, by State
-

 Mining2 weeks ago
Visualizing Global Gold Production in 2023
-

 Markets1 week ago
Visualized: Interest Rate Forecasts for Advanced Economies
-

 Economy1 week ago
The Most Valuable Companies in Major EU Economies