
The price of natural gas has closely approached the psychological level of 3.00 USD/MMBtu. At that, the asset’s price is trying to test this level for the third time in a row. As the cold season approaches, the demand for natural gas will gradually increase since it plays a crucial role in heating residential and municipal buildings. Geopolitics also strongly affect gas prices. So, the price of gas might potentially break the level of 3.00 USD/MMBtu and target the resistance level of 4.00 next. Also, a fine bottom with the neckline can be spotted on the daily and weekly timeframes, just at the level of 3.00. And this matter should be considered too.

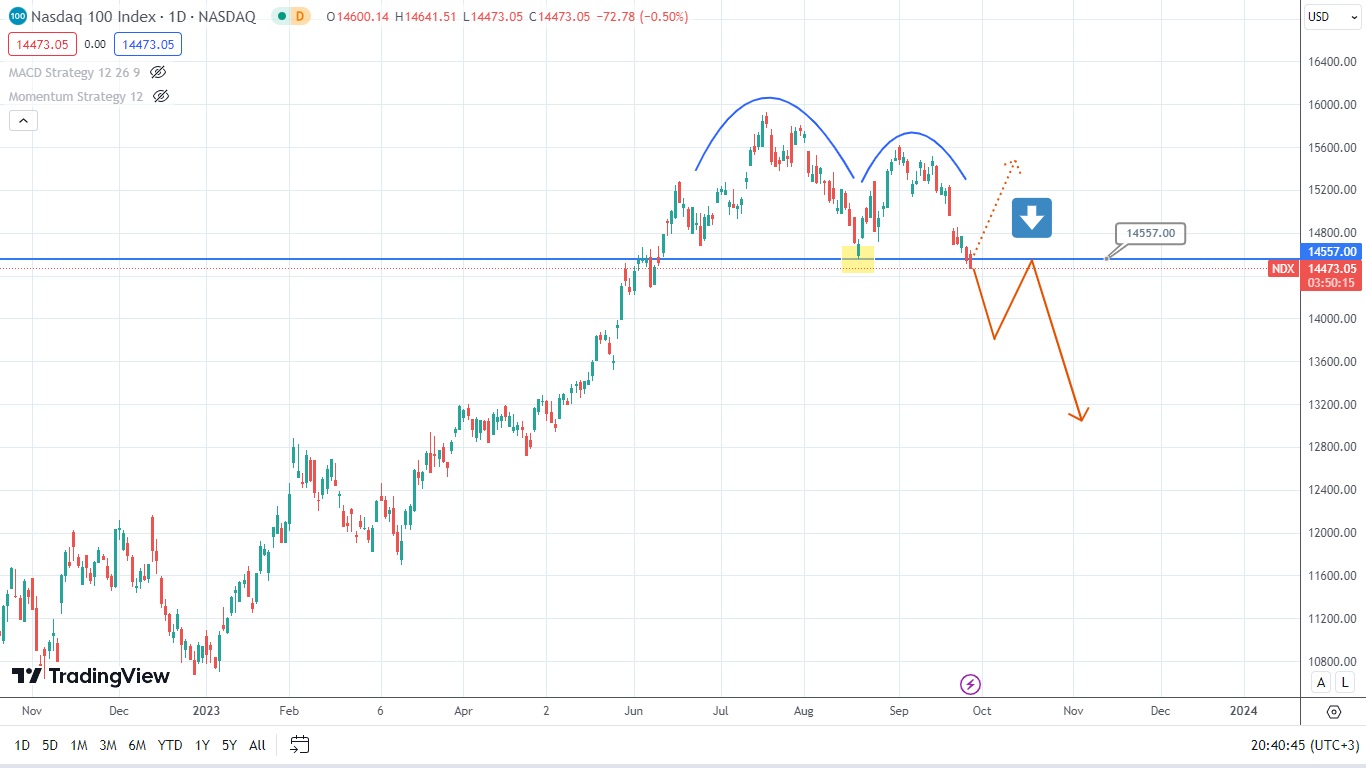
As can be seen from the daily timeframe, the index NASDAQ 100 is currently trying to break the supporting level of 14557, which also acts as a neckline of the double top or a sort of failure swing. Of course, the asset’s price might also rebound from the supporting level and rise again. Therefore, keep an eye on whether the true breakout happens and perhaps follow the candlestick formations to figure out what could happen next.
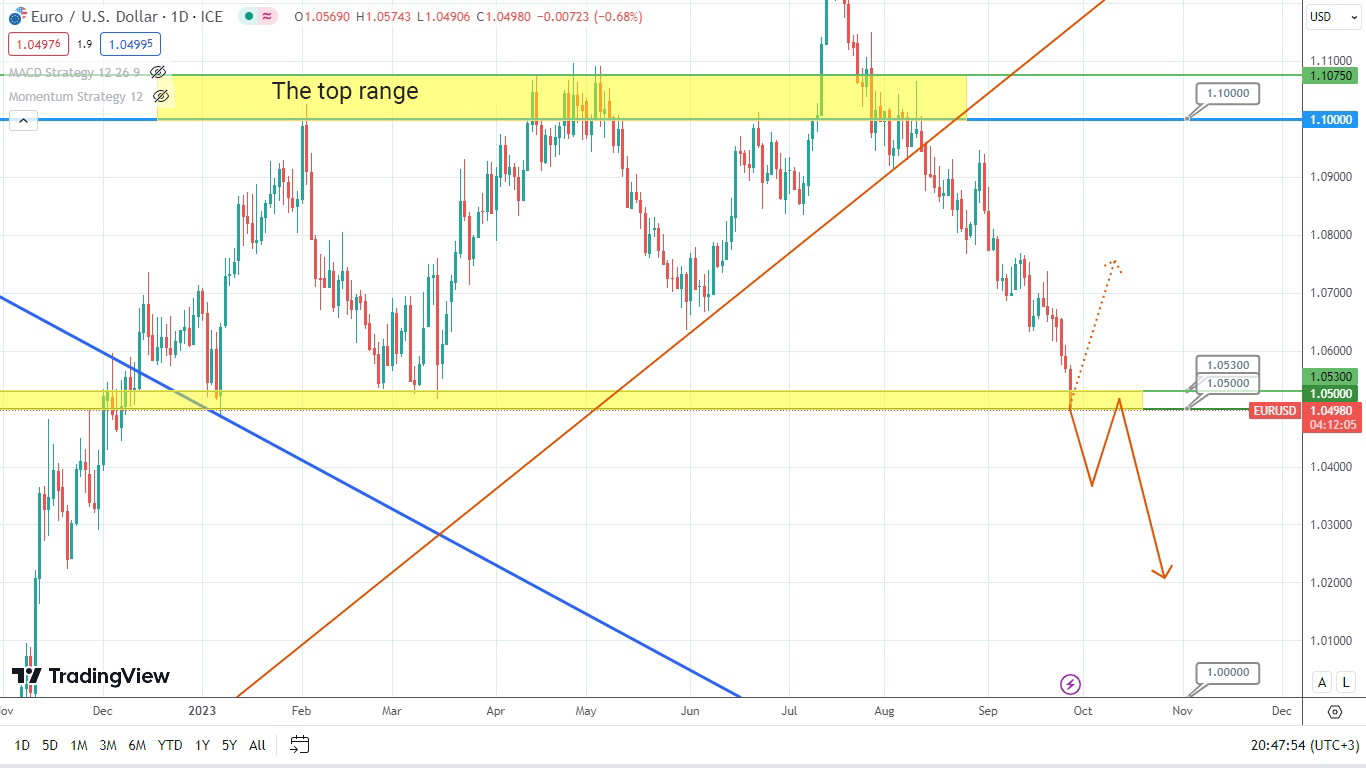
The currency pair EUR/USD is now testing a very important supporting zone formed between the levels 1.0500 and 1.0530. Should the asset’s price break through this zone, it might quickly drop. However, it might also rebound and jump. In this case, check the candlestick formations to forecast the upcoming price movements.
Disclaimer: The material provided is for information purposes only and should not be considered as investment advice. The views, information, or opinions expressed in the text belong solely to the author, and not to the author’s employer, organization, committee or other group or individual or company.
Past performance is not indicative of future results.
High Risk Warning: CFDs are complex instruments and come with a high risk of losing money rapidly due to leverage. 71% and 70% of retail investor accounts lose money when trading CFDs with Tickmill UK Ltd and Tickmill Europe Ltd respectively. You should consider whether you understand how CFDs work and whether you can afford to take the high risk of losing your money.