Technical Analysis – USDJPY smashes through heavy resistance
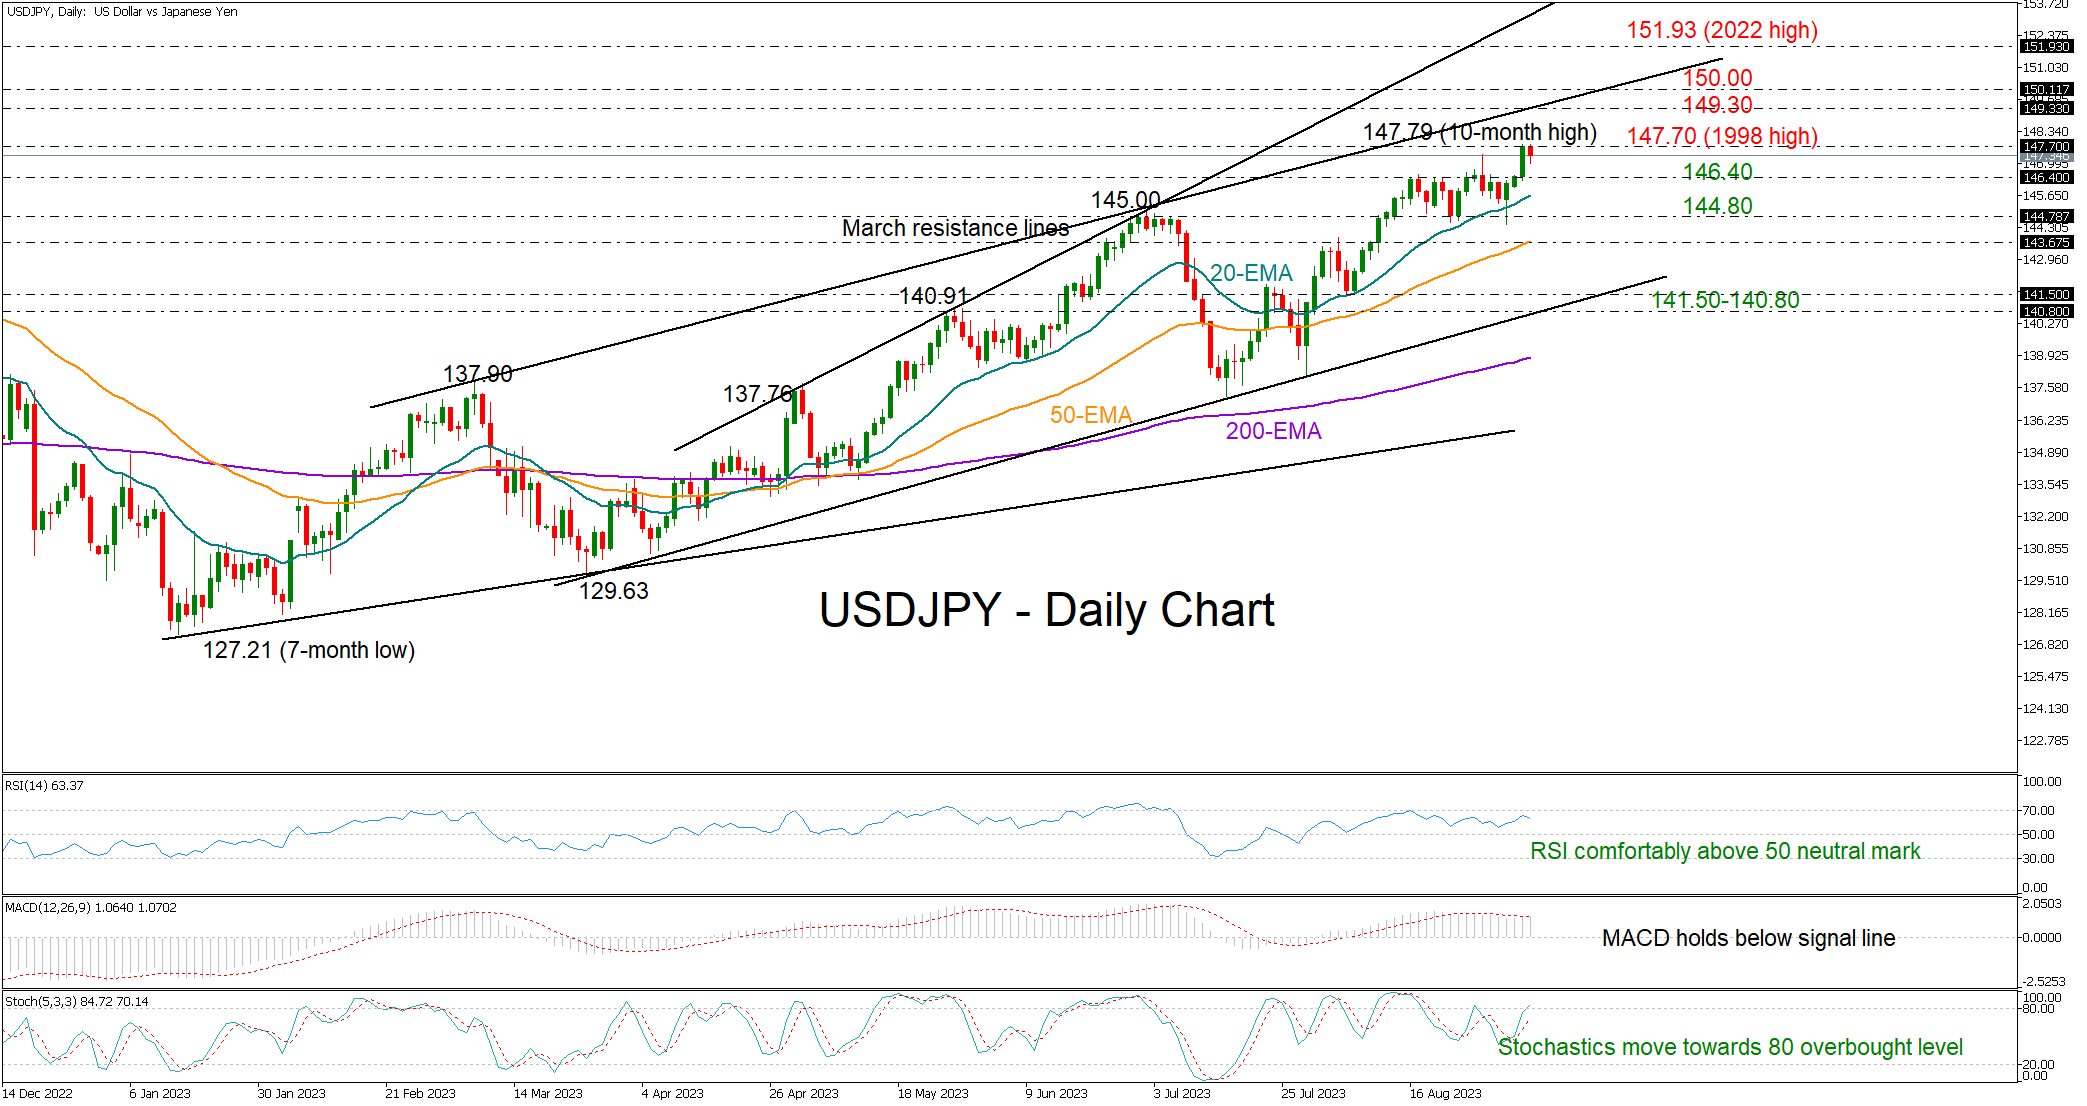
Despite Tuesday’s quick bounce in the price, the MACD could not climb above its red signal line. On the other hand, the RSI is hovering comfortably above its 50 neutral mark, while the stochastic oscillator has resumed its positive slope, witnessing persisting buying interest.
The upward-sloping exponential moving averages (EMA) are embracing the positive trend in the market.
If the bulls pierce through the 147.70 barricade, the next challenge could arise near the tentative ascending line from March 2023 at 149.30. The 150.00 psychological mark could come into consideration as well before traders target the 32-year high of 151.93 printed in October 2022.
On the downside, the 146.40 area could turn into a support region if the current weakness in the price continues. The 20-day EMA might also block the way down ahead of the 144.80 level. If the sell-off extends below the 50-day EMA, the next stop could be within the 140.80-141.50 zone, where the ascending trendline from March 2023 is located.
In brief, USDJPY has upgraded its 2023 bullish outlook above a tough resistance, boosting hopes for a continuation higher.
Related Assets
Latest News
Disclaimer: The XM Group entities provide execution-only service and access to our Online Trading Facility, permitting a person to view and/or use the content available on or via the website, is not intended to change or expand on this, nor does it change or expand on this. Such access and use are always subject to: (i) Terms and Conditions; (ii) Risk Warnings; and (iii) Full Disclaimer. Such content is therefore provided as no more than general information. Particularly, please be aware that the contents of our Online Trading Facility are neither a solicitation, nor an offer to enter any transactions on the financial markets. Trading on any financial market involves a significant level of risk to your capital.
All material published on our Online Trading Facility is intended for educational/informational purposes only, and does not contain – nor should it be considered as containing – financial, investment tax or trading advice and recommendations; or a record of our trading prices; or an offer of, or solicitation for, a transaction in any financial instruments; or unsolicited financial promotions to you.
Any third-party content, as well as content prepared by XM, such as: opinions, news, research, analyses, prices and other information or links to third-party sites contained on this website are provided on an “as-is” basis, as general market commentary, and do not constitute investment advice. To the extent that any content is construed as investment research, you must note and accept that the content was not intended to and has not been prepared in accordance with legal requirements designed to promote the independence of investment research and as such, it would be considered as marketing communication under the relevant laws and regulations. Please ensure that you have read and understood our Notification on Non-Independent Investment. Research and Risk Warning concerning the foregoing information, which can be accessed here.