Markets
Ranked: The Top 100 Brands by Value in 2023
View a higher resolution version of this graphic.
 Can I share this graphic?
 When do I need a license?
 Interested in this piece?
Ranked: The Top 100 Brands by Value in 2023
View a higher resolution version of this graphic.
Brand value can be a critical part of any company’s intangible assets.
These kind of non-physical assets, such as patents and brand names, are having an increasing influence on a company’s overall value. A 2020 analysis found that intangibles made up 90% of the S&P 500’s market value, an increase of 22 percentage points since 1995.
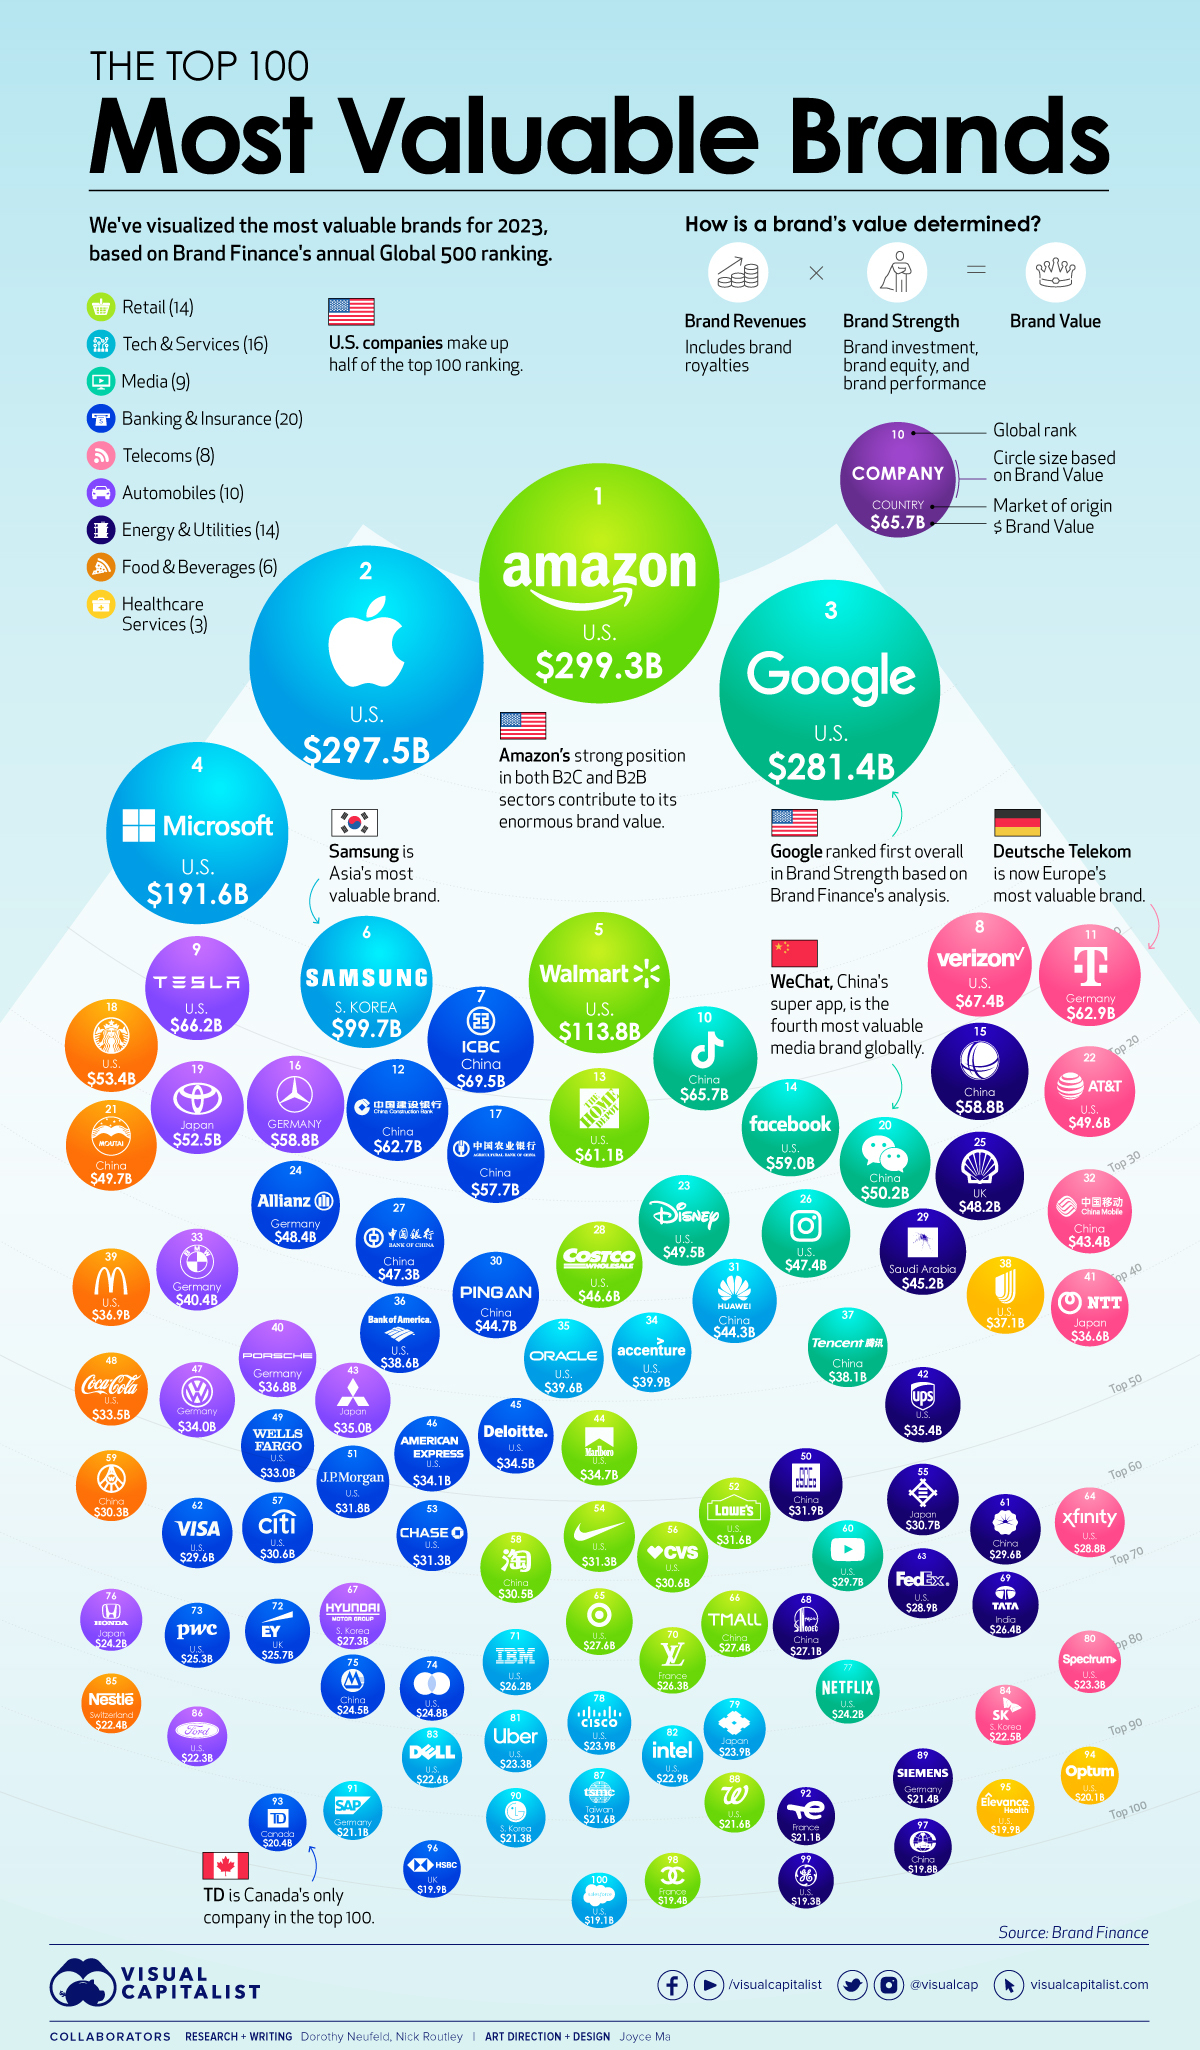
This graphic shows the world’s 100 most valuable brands in 2023 based on an annual ranking from Brand Finance, illustrating the role brand equity plays in a company’s market position.
The Top 100 Companies, by Brand Value
Brand Finance examined over 5,000 companies (and in cases of groups like Alphabet and Meta, their subsidiary brands) across 38 countries.
Broadly speaking, a brand’s value represents the allocation of company earnings that are linked to the brand. More details on the methodology are found at the end of this article.
Here are the most valuable brands in 2023:
| Rank | Brand | Brand Value (B) | Country | Sector |
|---|---|---|---|---|
| 1 | Amazon | $299.3 | U.S. | Retail |
| 2 | Apple | $297.5 | U.S. | Tech |
| 3 | $281.4 | U.S. | Media | |
| 4 | Microsoft | $191.6 | U.S. | Tech |
| 5 | Walmart | $113.8 | U.S. | Retail |
| 6 | Samsung Group | $99.7 | South Korea | Tech |
| 7 | ICBC | $69.5 | China | Banking |
| 8 | Verizon | $67.4 | U.S. | Telecoms |
| 9 | Tesla | $66.2 | U.S. | Automobiles |
| 10 | TikTok/Douyin | $65.7 | China | Media |
| 11 | Deutsche Telekom | $62.9 | Germany | Telecoms |
| 12 | China Construction Bank | $62.7 | China | Banking |
| 13 | Home Depot | $61.1 | U.S. | Retail |
| 14 | $59.0 | U.S. | Media | |
| 15 | State Grid | $58.8 | China | Utilities |
| 16 | Mercedes-Benz | $58.8 | Germany | Automobiles |
| 17 | Agricultural Bank Of China | $57.7 | China | Banking |
| 18 | Starbucks | $53.4 | U.S. | Restaurants |
| 19 | Toyota | $52.5 | Japan | Automobiles |
| 20 | $50.2 | China | Media | |
| 21 | Moutai | $49.7 | China | Spirits |
| 22 | AT&T | $49.6 | U.S. | Telecoms |
| 23 | Disney | $49.5 | U.S. | Media |
| 24 | Allianz Group | $48.4 | Germany | Insurance |
| 25 | Shell | $48.2 | UK | Oil & Gas |
| 26 | $47.4 | U.S. | Media | |
| 27 | Bank of China | $47.3 | China | Banking |
| 28 | Costco | $46.6 | U.S. | Retail |
| 29 | Aramco | $45.2 | Saudi Arabia | Oil & Gas |
| 30 | Ping An | $44.7 | China | Insurance |
| 31 | Huawei | $44.3 | China | Tech |
| 32 | China Mobile | $43.4 | China | Telecoms |
| 33 | BMW | $40.4 | Germany | Automobiles |
| 34 | accenture | $39.9 | U.S. | Tech |
| 35 | Oracle | $39.6 | U.S. | Tech |
| 36 | Bank of America | $38.6 | U.S. | Banking |
| 37 | Tencent | $38.1 | China | Media |
| 38 | UnitedHealthcare | $37.1 | U.S. | Healthcare Services |
| 39 | McDonald's | $36.9 | U.S. | Restaurants |
| 40 | Porsche | $36.8 | Germany | Automobiles |
| 41 | NTT Group | $36.6 | Japan | Telecoms |
| 42 | UPS | $35.4 | U.S. | Logistics |
| 43 | Mitsubishi Group | $35.0 | Japan | Automobiles |
| 44 | Marlboro | $34.7 | U.S. | Tobacco |
| 45 | Deloitte | $34.5 | U.S. | Commercial Services |
| 46 | American Express | $34.1 | U.S. | Commercial Services |
| 47 | Volkswagen | $34.0 | Germany | Automobiles |
| 48 | Coca-Cola | $33.5 | U.S. | Soft Drinks |
| 49 | Wells Fargo | $33.0 | U.S. | Banking |
| 50 | CSCEC | $31.9 | China | Engineering & Construction |
| 51 | J.P. Morgan | $31.8 | U.S. | Banking |
| 52 | Lowe's | $31.6 | U.S. | Retail |
| 53 | Chase | $31.3 | U.S. | Banking |
| 54 | Nike | $31.3 | U.S. | Apparel |
| 55 | Mitsui | $30.7 | Japan | Engineering & Construction |
| 56 | CVS | $30.6 | U.S. | Retail |
| 57 | Citi | $30.6 | U.S. | Banking |
| 58 | Taobao | $30.5 | China | Retail |
| 59 | Wuliangye | $30.3 | China | Spirits |
| 60 | YouTube | $29.7 | U.S. | Media |
| 61 | PetroChina | $29.6 | China | Oil & Gas |
| 62 | VISA | $29.6 | U.S. | Commercial Services |
| 63 | FedEx | $28.9 | U.S. | Logistics |
| 64 | Xfinity | $28.8 | U.S. | Telecoms |
| 65 | Target | $27.6 | U.S. | Retail |
| 66 | Tmall | $27.4 | China | Retail |
| 67 | Hyundai Group | $27.3 | South Korea | Automobiles |
| 68 | Sinopec | $27.1 | China | Oil & Gas |
| 69 | Tata Group | $26.4 | India | Engineering & Construction |
| 70 | Louis Vuitton | $26.3 | France | Apparel |
| 71 | IBM | $26.2 | U.S. | Tech |
| 72 | EY | $25.7 | UK | Commercial Services |
| 73 | PWC | $25.3 | U.S. | Commercial Services |
| 74 | Mastercard | $24.8 | U.S. | Commercial Services |
| 75 | China Merchants Bank | $24.5 | China | Banking |
| 76 | Honda | $24.2 | Japan | Automobiles |
| 77 | Netflix | $24.2 | U.S. | Media |
| 78 | Cisco | $23.9 | U.S. | Tech |
| 79 | Sumitomo Group | $23.9 | Japan | Trading Houses |
| 80 | Spectrum | $23.3 | U.S. | Telecoms |
| 81 | Uber | $23.3 | U.S. | Mobility |
| 82 | Intel | $22.9 | U.S. | Tech |
| 83 | Dell Technologies | $22.6 | U.S. | Tech |
| 84 | SK Group | $22.5 | South Korea | Telecoms |
| 85 | Nestlé | $22.4 | Switzerland | Food |
| 86 | Ford | $22.3 | U.S. | Automobiles |
| 87 | TSMC | $21.6 | Taiwan | Tech |
| 88 | Walgreens | $21.6 | U.S. | Retail |
| 89 | Siemens Group | $ 21.4 | Germany | Engineering & Construction |
| 90 | LG Group | $21.3 | South Korea | Tech |
| 91 | SAP | $21.1 | Germany | Tech |
| 92 | TotalEnergies | $20.7 | France | Oil & Gas |
| 93 | TD | $20.4 | Canada | Banking |
| 94 | Optum | $20.1 | U.S. | Healthcare Services |
| 95 | Elevance Health (formerly Anthem) | $19.9 | U.S. | Healthcare Services |
| 96 | HSBC | $19.9 | UK | Banking |
| 97 | CREC | $19.8 | China | Engineering & Construction |
| 98 | CHANEL | $19.4 | France | Apparel |
| 99 | General Electric | $19.3 | U.S. | Engineering & Construction |
| 100 | Salesforce | $19.1 | U.S. | Tech |
Amazon ranks number one globally with its brand valued at $299 billion. As a market leader in online retail, it has strong brand loyalty in its B2C segment which generates its largest share of revenue, and is a key player in cloud services for its B2B platforms.
Apple is in close second with a $298 billion brand. It’s important to note that both tech giants brands fell in value from last year, as supply chain disruptions, labor market constraints, and slower forecasted revenue impacted their brands.
Other big tech brands Google (#3) and Microsoft (#4) were next in the ranking. Korean conglomerate Samsung (#6) was the highest-ranking firm based outside of America.
Brand Value: Leading Sectors in 2023
Looking at brand value based on sector, we can see that tech continues to dominate. The sector breakdown below uses data from the top 500 brands covered by Brand Finance.
| Rank | Sector | % of Total | Total Brand Value (B) |
|---|---|---|---|
| 1 | Tech | 19.4% | $891.2 |
| 2 | Retail | 15.0% | $690.0 |
| 3 | Media | 14.0% | $645.2 |
| 4 | Banking | 10.2% | $467.4 |
| 5 | Automobiles | 8.6% | $397.3 |
| 6 | Telecoms | 7.3% | $334.6 |
| 7 | Commercial Services | 3.8% | $174.0 |
| 8 | Oil & Gas | 3.7% | $171.0 |
| 9 | Engineering & Construction | 3.3% | $149.5 |
| 10 | Insurance | 2.0% | $93.0 |
| 11 | Restaurants | 2.0% | $90.3 |
| 12 | Spirits | 1.7% | $80.0 |
| 13 | Healthcare Services | 1.7% | $77.1 |
| 14 | Apparel | 1.7% | $77.0 |
| 15 | Logistics | 1.4% | $64.3 |
| 16 | Utilities | 1.3% | $58.8 |
| 17 | Tobacco | 0.8% | $34.7 |
| 18 | Soft Drinks | 0.7% | $33.5 |
| 19 | Trading Houses | 0.5% | $23.9 |
| 20 | Mobility | 0.5% | $23.3 |
| 21 | Food | 0.5% | $22.4 |
Overall, the top tech brands were worth a combined $891 billion largely thanks to the outsized influence of Apple, Microsoft, and Samsung.
After retail and media, the banking sector still held significant brand sway at $467 billion. Automobiles rounded out the top five sectors at $397 billion, led by companies like Tesla and Mercedes-Benz.
The Fastest Rising Brands in 2023
While some brands such as Apple and Amazon fell in value over the last year, others have increased their brand value.
Below, we show the fastest rising brands across the top 500 around the world:
| Rank | Name | Brand Value % Change (2022-2023) |
|---|---|---|
| 1 | BYD | 57% |
| 2 | ConocoPhillips | 56% |
| 3 | Maersk | 53% |
| 4 | 49% | |
| 5 | Christian Dior | 46% |
| 6 | Tesla | 44% |
| 7 | ADP | 44% |
| 8 | United Airlines | 42% |
| 9 | 42% | |
| 10 | Equinor | 40% |
BYD, a leading electric vehicle (EV) firm in China, jumped the sharpest. Focused on budget EVs and backed by Warren Buffett, it has become a growing competitor to Tesla, and is the second-largest producer of lithium-ion batteries globally.
Energy firm ConocoPhillips saw the second-largest gain in brand value, driven by its focus on energy transition fuels, cutting production emissions, and lowering supply costs.
Following a series of difficult years for the airline industry, United Airline’s brand value increased 42% as travel demand accelerated.
As the economic landscape continues to shift, the value of these brands will shift as well.
Where does this data come from?
Source: Brand Finance Global 500 Report
Important note: The values shown above are brand value calculations as opposed to market capitalization. See below for more details.
How is brand value calculated? Generally speaking, the methodology for calculating “brand value” is a formula that is as follows:
Brand Strength (BSI) x Brand Royalty Rate x Brand Revenues = Brand Value
Brand Strength Index (BSI) looks at brand investment, brand equity, and brand performance. The brand royalty rate is determined based on sector. Lastly, forecast brand-specific revenues are determined based on the proportion of parent company revenues attributable to the brand in question. Brand value itself is discounted to net present value.
We recommend visiting page 83 of the report to view the full explanation of the methodology.


Markets
The Top Retailers in the World, by Store Count
Here are the top retailers in the world by physical store presence, illustrating the dominance of convenience and drug store chains.
The Top Retailers in the World, by Store Count
This was originally posted on our Voronoi app. Download the app for free on iOS or Android and discover incredible data-driven charts from a variety of trusted sources.
Which retail chains have the highest global store counts?
Owing to their rapid speed of service in providing the basics to customers, convenience chains stand as the clear leaders. Going further, their smaller footprint allows them to expand their store counts at a greater scale.
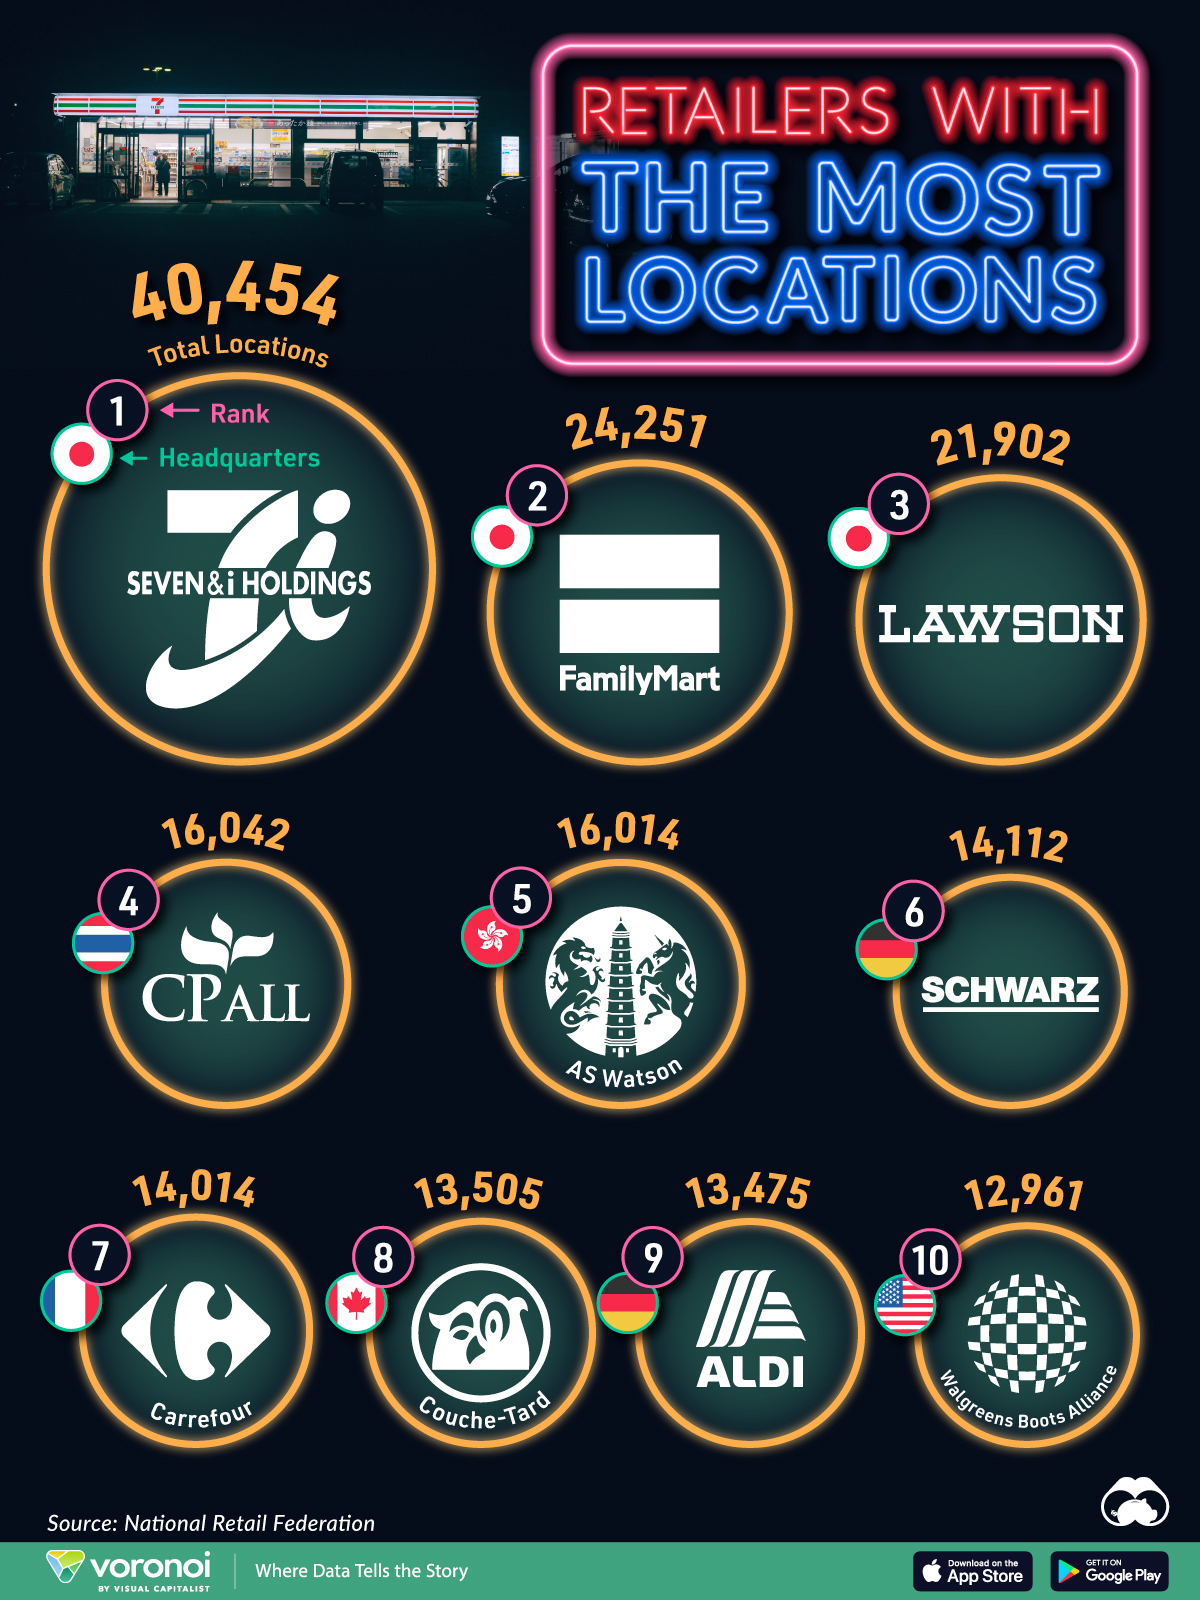
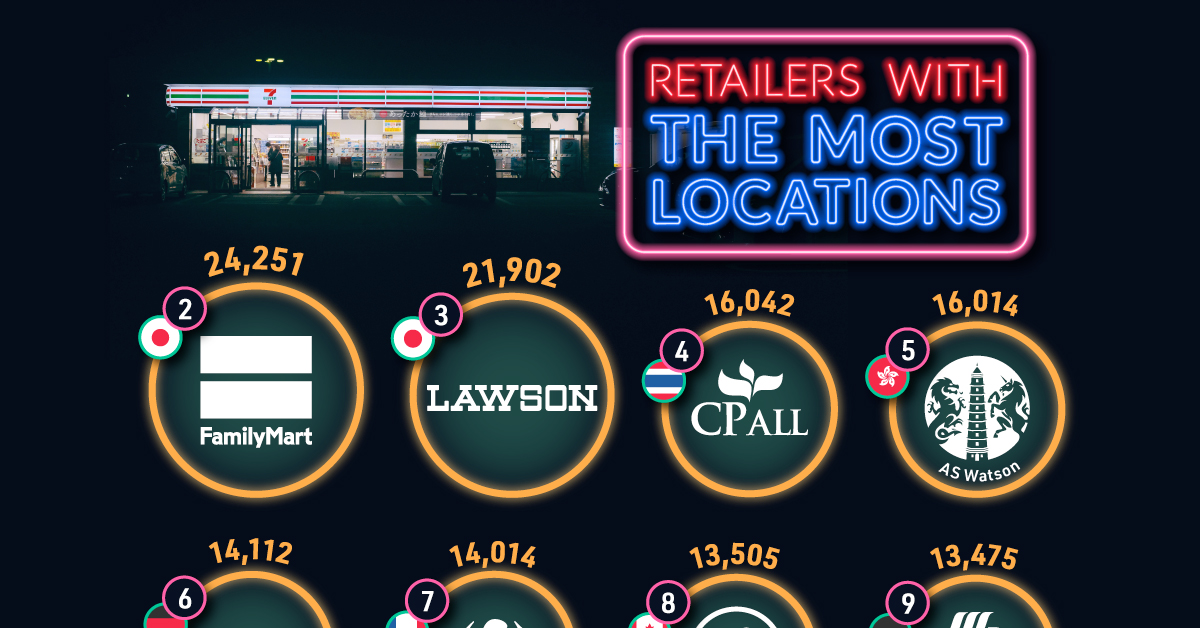
This graphic shows the top retailers in the world by store count, based on data from the National Retailers Federation.
Japanese Retailers Dominate the Pack
Below, we show the global retailers with the most physical storefronts in 2023:
| Ranking | Retailer | Total Stores Worldwide | Industry | Headquarters |
|---|---|---|---|---|
| 1 | Seven & I | 40,454 | Convenience Store | 🇯🇵 Japan |
| 2 | FamilyMart | 24,251 | Convenience Store | 🇯🇵 Japan |
| 3 | Lawson | 21,902 | Convenience Store | 🇯🇵 Japan |
| 4 | CP All | 16,042 | Convenience Store | 🇹🇭 Thailand |
| 5 | AS Watson | 16,014 | Drug Store | 🇭🇰 Hong Kong |
| 6 | Schwarz Group | 14,112 | Discount Grocery | 🇩🇪 Germany |
| 7 | Carrefour | 14,014 | Supermarkets | 🇫🇷 France |
| 8 | Couche-Tard | 13,505 | Convenience Store | 🇨🇦 Canada |
| 9 | Aldi | 13,475 | Discount Grocery | 🇩🇪 Germany |
| 10 | Walgreens Boots Alliance | 12,961 | Drug Store | 🇺🇸 U.S. |
Leading by a wide margin is Japan’s Seven & I Holdings, with 40,454 store locations worldwide.
The retail giant includes the 7-Eleven franchise along with Ito-Yokado, its supermarket chain. While the world’s largest convenience chain traces its origins to Dallas, Texas, the remainder of the U.S-based company (27%) was acquired in 2005 in a $1.2 billion deal that took the company fully private. Today, the company operates in 10 markets globally.
Next in line are Japan’s FamilyMart and Lawson, each boasting over 20,000 locations. For perspective, Walmart, America’s largest retail company by revenues, operates 10,569 locations globally.
In Europe, Germany’s discount grocery chain Schwarz takes the lead, due to its extensive network of stores. Operating across 30 countries and with over 500,000 employees, the no-frills chain stands as a powerhouse. France’s supermarket giant, Carrefour, follows closely behind.
Ranking in eighth is Canadian retailer, Couche-Tard, with stores largely concentrated in North America and Europe. Since 2004, the company has made over 60 acquisitions, including 2,200 gas stations from French oil company TotalEnergies in 2023. The company is known for its Circle K brand, which operates in 24 countries globally.
Closing off the list is Walgreens Boots Alliance, the only American retailer in the rankings. The company owns the ubiquitous UK-based Boots brand, which was founded in 1849 in Nottingham. Yet as profits margins face increasing strains, it is looking to sell the subsidiary and instead focus more heavily on its U.S. pharmacy and healthcare businesses. With a presence in 13 countries, the pharmacy chain operates 12,961 stores worldwide.

-
 Markets1 week ago
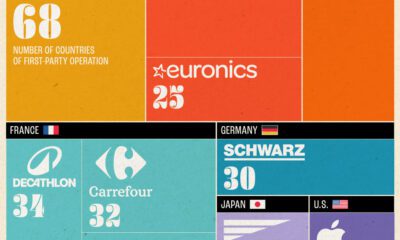
Which Retailers Operate in the Most Countries?
-
 Money2 weeks ago
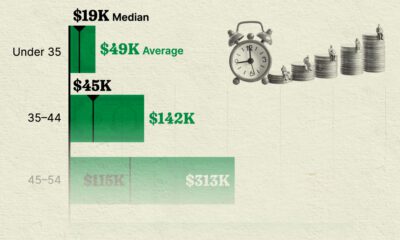
Visualizing America’s Average Retirement Savings, by Age
-

 Markets2 weeks ago
Top 10 Countries Most in Debt to the IMF
-

 United States2 weeks ago
Charted: How Democrats and Republicans View Government Agencies
-

 Maps2 weeks ago
Mapped: The Top Exports in Asian Countries
-

 Venture Capital2 weeks ago
Ranked: The World’s 50 Largest Private Equity Firms
-

 Maps2 weeks ago
Mapped: The 10 U.S. States With the Lowest Real GDP Growth
-

 China2 weeks ago
Comparing New and Current U.S. Tariffs on Chinese Imports