Yen Left Adrift as Bank of Japan’s Dovish Position Holds Steady

The dollar is gradually recovering after major losses last week:

The plunge occurred on Thursday following the release of the US import price data. In May, import prices declined by 0.6% for the month, allowing market participants to reassess the level of expected US inflation and consequently the likelihood of a July tightening by the Federal Reserve (Fed). Previously, during the FOMC meeting, Fed Chair Powell stated that the central bank would increasingly rely on incoming data to make decisions. Such statements are typically made when the central bank anticipates an approaching turning point in the business cycle, in this case, a definitive shift to lower inflation trends. In other cases, central banks often resort to implicit guarantees (forward guidance) that they may continue to lower or raise rates for some time. Approaching a turning point consequently increases market sensitivity to the incoming data points, which often go unnoticed. In this case, it was import prices and initial jobless claims, which once again exceeded expectations.
From a technical analysis perspective, the dollar index is trading within a downward corridor. Last week, during the decline, the price confirmed the lower boundary of this corridor (at the level of 102 on the DXY) and entered into a bullish correction on Monday. The magnitude of movements is insignificant, reflecting the fact that the major events that could have influenced market expectations occurred last week.
The analysis of the Bank of Japan meeting, which took place last Friday, is also noteworthy as it may have serious consequences for the yen. The market was not expecting a rate hike since the central bank continues to use a more powerful easing tool by controlling the yield of long-term government bonds. When it approaches a certain upper boundary (in this case, 0.5%), the Bank of Japan begins to buy bonds, thereby preventing the yield from rising further. Thus, the cost of long-term borrowing in the economy is maintained at a very low level given the current circumstances. It looks like this:

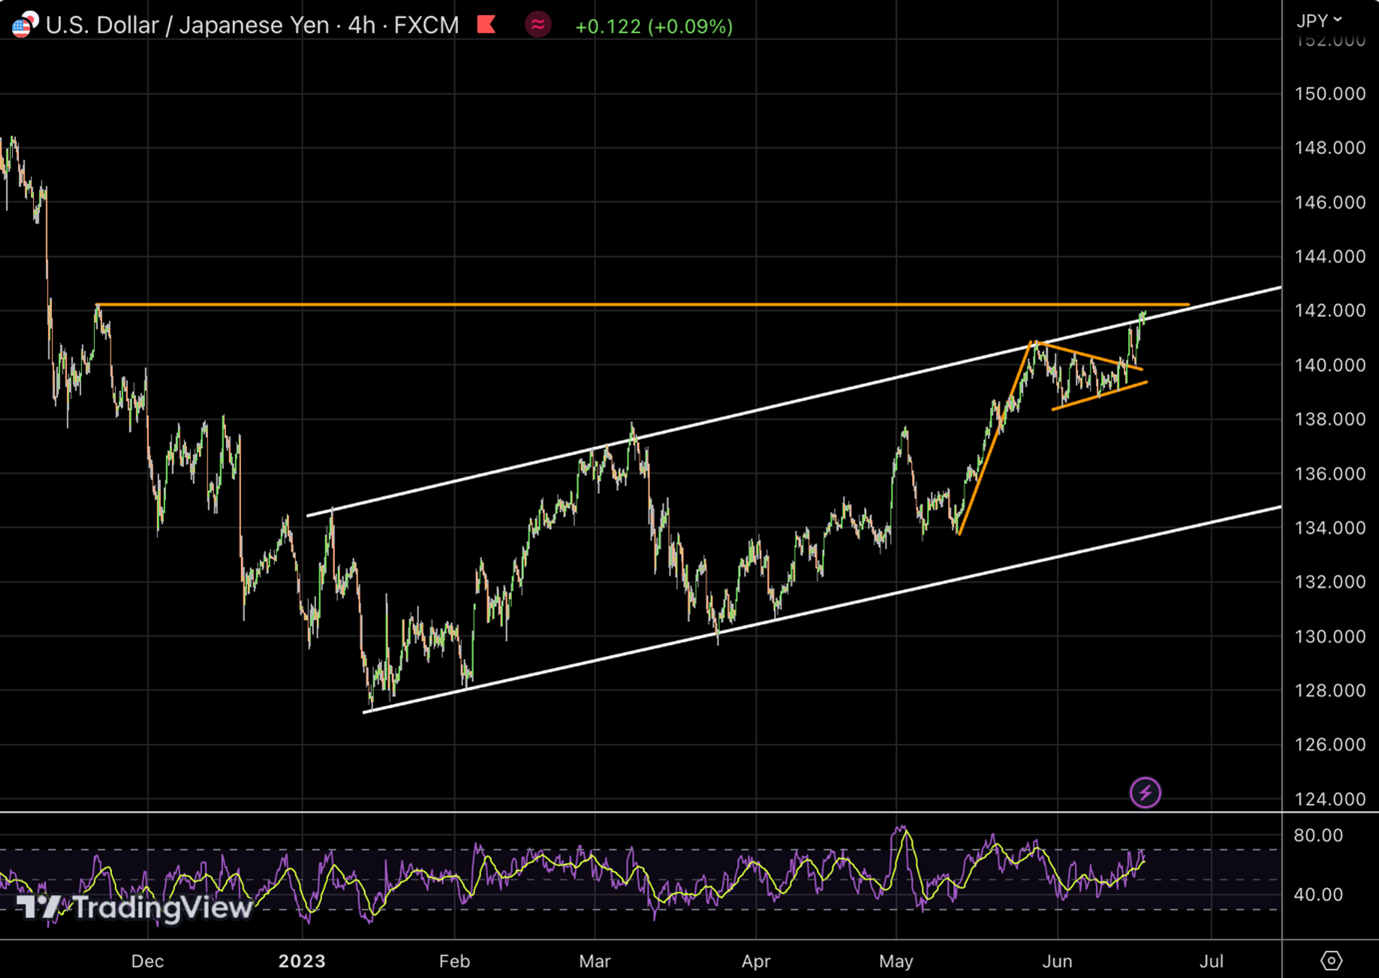
The central bank was expected to allow for wider yield movements (declare an upper boundary above 0.5%), but it did not even do that. This further widens the policy gap between the Bank of Japan and other central banks that are raising rates, and the Japanese yen weakened against the dollar even during its steep decline last week. On the USD/JPY technical chart, it can be seen that the price tested the upper boundary of the channel multiple times and broke out of it last week. It is worth noting the flag pattern (rise + consolidation) before the breakout, which suggests that the decline of the yen will likely continue. Some resistance is likely to emerge near the November 2022 high (at the level of 142.50):
Disclaimer: The material provided is for information purposes only and should not be considered as investment advice. The views, information, or opinions expressed in the text belong solely to the author, and not to the author’s employer, organization, committee or other group or individual or company.
Past performance is not indicative of future results.
High Risk Warning: CFDs are complex instruments and come with a high risk of losing money rapidly due to leverage. 71% and 70% of retail investor accounts lose money when trading CFDs with Tickmill UK Ltd and Tickmill Europe Ltd respectively. You should consider whether you understand how CFDs work and whether you can afford to take the high risk of losing your money.