How A Fed Rate Pause Is Likely To Morph Into A Cut
Authored by Simon White, Bloomberg macro strategist,
The Federal Reserve’s next move after an anticipated pause is more likely to be a cut than a hike due to already restrictive rates, falling inflation and a recessionary economy.
Pause talk is in the air – with the market pricing in only a ~30% chance of a rate rise at next week’s Fed meeting – before further hikes. But the world, and the Fed, could look sufficiently different even by late summer that the risk calculus starts to favor looser monetary policy.
There are three main factors that could alter the Fed’s decision-making framework and prompt it to step back from its hiking cycle after a hiatus:
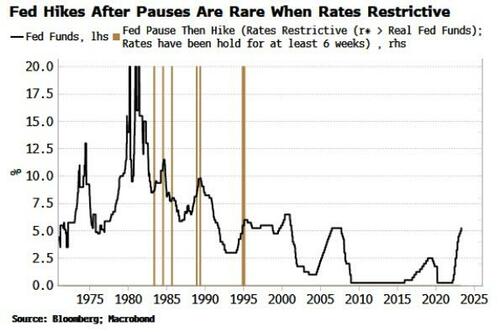
The Fed very rarely raises rates again after pausing when policy is already restrictive
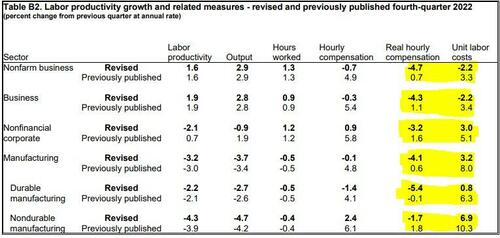
Inflation will keep falling in the coming months, while labor-cost pressures are being revised significantly lower
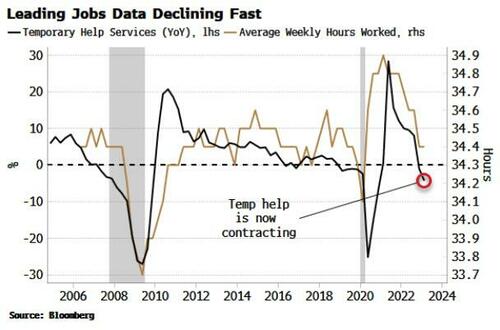
The jobs market is weakening fast
It might be a surprise, but it’s rare indeed for the Fed to re-tighten policy after pausing. It’s even rarer for it to do so when rates are already restrictive.
Moreover, as the chart below shows, the instances of this in the early 80s occurred when rates were in a longer-term downtrend, unlike today. It would thus be almost unprecedented (albeit not impossible) for the Fed to raise rates again after pausing.
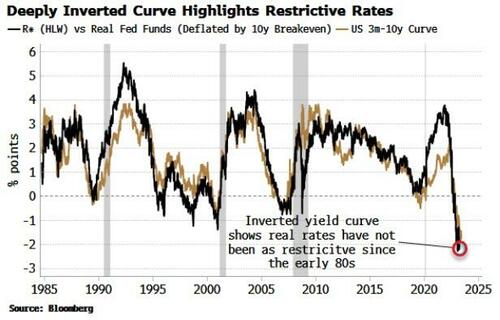
By several measures, rates are already very restrictive. Real policy rates are about to be above r*, the estimate of neutral. It’s an imperfect measurement with many assumptions. But inflation-fixing swaps see the real Fed rate at 2%-2.5% through summer, well enough above the latest r* estimate of about 0.6% to indicate policy is indeed restrictive.
This is underscored by the yield curve’s inversion, which is giving us a transparent read on how restrictive rates are. The 3m-10y curve is almost a facsimile of the degree of restriction in the real policy rate.
It’s no wonder some banks went under. The heavily inverted curve is a barometer of rate stress building up in the system, and a reminder that other unexpected grenades could go off and upend the Fed’s current outlook.
The inflation backdrop will also look very different in the coming months, with headline CPI set to fall to near 3%, according to fixing swaps. Core CPI should also keep falling for now, based on leading indicators.
The Fed is focused on wage growth for inflationary signs. But real wages are either still negative or barely positive, depending on what measure of compensation you use.
Furthermore, wage pressures are not nearly as high as they were thought to be. Last week’s release of employment data saw significant downward revisions to real hourly compensation and unit labor costs for the last quarter of 2022, as seen in the last two columns in the table below.
Source: BLS
The jobs situation may look very different soon too. Remember that unemployment is one of the most lagging indicators. Typically, the labor market looks in reasonable shape when a recession is already underway. It’s also not unusual to see some unexpectedly high payrolls numbers at this time (even if they may well be subsequently revised much lower).
It’s prudent instead to focus on the most forward-looking employment indicators. Two of these are temporary help and average weekly hours worked. Employers are likely to cull temp workers and cut full-time employees’ hours before they move to sacking people. This is also why more lagging measures of employment tend to hold up until after the recession has begun.
Both temp help and hours worked are falling quickly. The jobs situation – and therefore the Fed’s risk-reward for hiking rates again – could look sizably different in the coming months, especially as a near-term recession looks exceedingly likely.
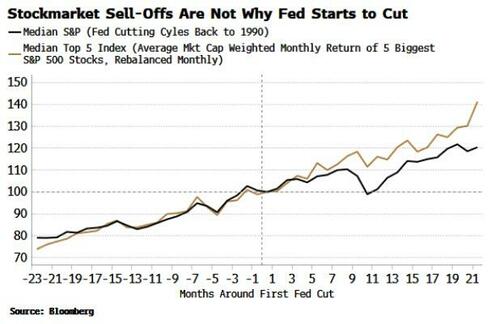
The megacap-styled elephant in the room is the stock market. Can the Fed cut rates when there is a veritable buying frenzy in a few corners of the market?
You might expect the market to bounces the Fed into a rate cut by selling off first. But that’s not what has happened on average over the last 30 years. As the chart below shows, the S&P tends to rally into the first Fed cut of the cycle.
Moreover, the chart also shows this is the same for the largest stocks, which are driving today’s market higher. The Top 5 Index rallies into the first rate cut and continues to do so afterward.
Canada and Australia’s recent rate hikes are adding a dose of uncertainty to the Fed’s outlook. This may add more volatility to anticipated policy rather than policy itself.
Nevertheless, the Fed will have an increasing number of off-ramps allowing it to refrain from further hikes. And the longer it does so, the more the backdrop will favor policy loosening. The pause that refreshes may end up being the prelude to a cut.


