Markets
Interest Rate Hikes vs. Inflation Rate, by Country
Interest Rate Hikes vs. Inflation Rate, by Country
Imagine today’s high inflation like a car speeding down a hill. In order to slow it down, you need to hit the brakes. In this case, the “brakes” are interest rate hikes intended to slow spending. However, some central banks are hitting the brakes faster than others.
This graphic uses data from central banks and government websites to show how policy interest rates and inflation rates have changed since the start of the year. It was inspired by a chart created by Macrobond.
How Do Interest Rate Hikes Combat Inflation?
To understand how interest rates influence inflation, we need to understand how inflation works. Inflation is the result of too much money chasing too few goods. Over the last several months, this has occurred amid a surge in demand and supply chain disruptions worsened by Russia’s invasion of Ukraine.
In an effort to combat inflation, central banks will raise their policy rate. This is the rate they charge commercial banks for loans or pay commercial banks for deposits. Commercial banks pass on a portion of these higher rates to their customers, which reduces the purchasing power of businesses and consumers. For example, it becomes more expensive to borrow money for a house or car.
Ultimately, interest rate hikes act to slow spending and encourage saving. This motivates companies to increase prices at a slower rate, or lower prices, to stimulate demand.
Rising Interest Rates and Inflation
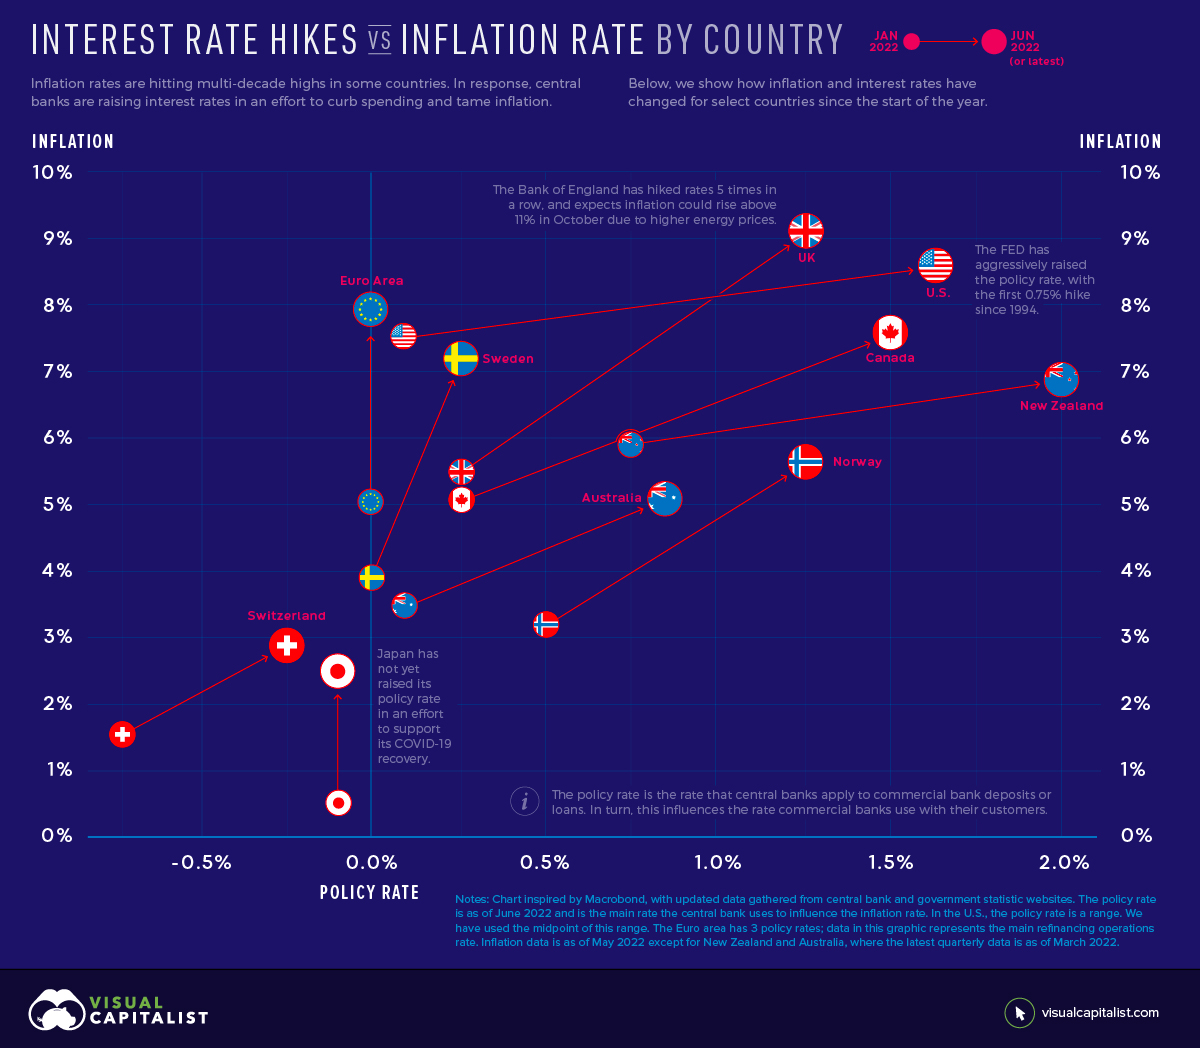
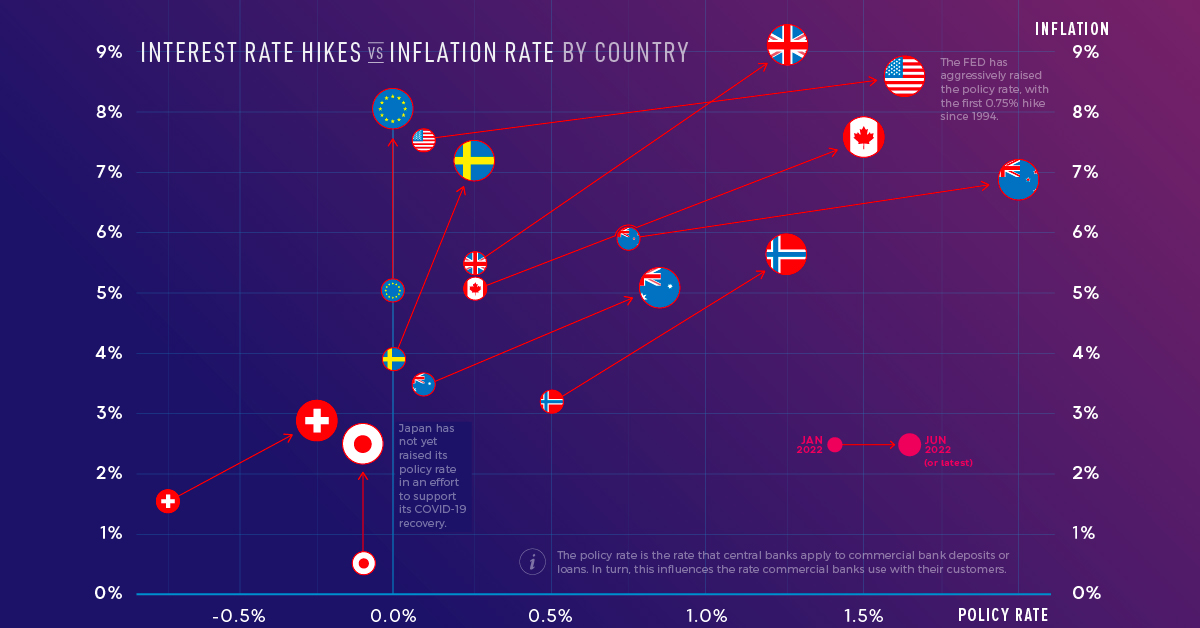
With inflation rates hitting multi-decade highs in some countries, many central banks have announced interest rate hikes. Below, we show how the inflation rate and policy interest rate have changed for select countries and regions since January 2022. The jurisdictions are ordered from highest to lowest current inflation rate.
| Jurisdiction | Jan 2022 Inflation | May 2022 Inflation | Jan 2022 Policy Rate | Jun 2022 Policy Rate |
|---|---|---|---|---|
| UK | 5.50% | 9.10% | 0.25% | 1.25% |
| U.S. | 7.50% | 8.60% | 0.00%-0.25% | 1.50%-1.75% |
| Euro Area | 5.10% | 8.10% | 0.00% | 0.00% |
| Canada | 5.10% | 7.70% | 0.25% | 1.50% |
| Sweden | 3.90% | 7.20% | 0.00% | 0.25% |
| New Zealand | 5.90% | 6.90% | 0.75% | 2.00% |
| Norway | 3.20% | 5.70% | 0.50% | 1.25% |
| Australia | 3.50% | 5.10% | 0.10% | 0.85% |
| Switzerland | 1.60% | 2.90% | -0.75% | -0.25% |
| Japan | 0.50% | 2.50% | -0.10% | -0.10% |
The Euro area has 3 policy rates; the data above represents the main refinancing operations rate. Inflation data is as of May 2022 except for New Zealand and Australia, where the latest quarterly data is as of March 2022.
The U.S. Federal Reserve has been the most aggressive with its interest rate hikes. It has raised its policy rate by 1.5% since January, with half of that increase occurring at the June 2022 meeting. Jerome Powell, the Federal Reserve chair, said the committee would like to “do a little more front-end loading” to bring policy rates to normal levels. The action comes as the U.S. faces its highest inflation rate in 40 years.
On the other hand, the European Union is experiencing inflation of 8.1% but has not yet raised its policy rate. The European Central Bank has, however, provided clear forward guidance. It intends to raise rates by 0.25% in July, by a possibly larger increment in September, and with gradual but sustained increases thereafter. Clear forward guidance is intended to help people make spending and investment decisions, and avoid surprises that could disrupt markets.
Pacing Interest Rate Hikes
Raising interest rates is a fine balancing act. If central banks raise rates too quickly, it’s like slamming the brakes on that car speeding downhill: the economy could come to a standstill. This occurred in the U.S. in the 1980’s when the Federal Reserve, led by Chair Paul Volcker, raised the policy rate to 20%. The economy went into a recession, though the aggressive monetary policy did eventually tame double digit inflation.
However, if rates are raised too slowly, inflation could gather enough momentum that it becomes difficult to stop. The longer high price increases linger, the more future inflation expectations build. This can result in people buying more in anticipation of prices rising further, perpetuating high demand.
“There’s always a risk of going too far or not going far enough, and it’s going to be a very difficult judgment to make.” — Jerome Powell, U.S. Federal Reserve Chair
It’s worth noting that while central banks can influence demand through policy rates, this is only one side of the equation. Inflation is also being caused by supply chain issues, a problem that is more or less outside of the control of central banks.


Markets
Visualizing Global Inflation Forecasts (2024-2026)
Here are IMF forecasts for global inflation rates up to 2026, highlighting a slow descent of price pressures amid resilient global growth.


Visualizing Global Inflation Forecasts (2024-2026)
Global inflation rates are gradually descending, but progress has been slow.
Today, the big question is if inflation will decline far enough to trigger easing monetary policy. So far, the Federal Reserve has held rates for nine months amid stronger than expected core inflation, which excludes volatile energy and food prices.
Yet looking further ahead, inflation forecasts from the International Monetary Fund (IMF) suggest that inflation will decline as price pressures ease, but the path of disinflation is not without its unknown risks.
This graphic shows global inflation forecasts, based on data from the April 2024 IMF World Economic Outlook.
Get the Key Insights of the IMF’s World Economic Outlook
Want a visual breakdown of the insights from the IMF’s 2024 World Economic Outlook report?
This visual is part of a special dispatch of the key takeaways exclusively for VC+ members.
Get the full dispatch of charts by signing up to VC+.
The IMF’s Inflation Outlook
Below, we show the IMF’s latest projections for global inflation rates through to 2026:
| Year | Global Inflation Rate (%) | Advanced Economies Inflation Rate (%) | Emerging Market and Developing Economies Inflation Rate (%) |
|---|---|---|---|
| 2019 | 3.5 | 1.4 | 5.1 |
| 2020 | 3.2 | 0.7 | 5.2 |
| 2021 | 4.7 | 3.1 | 5.9 |
| 2022 | 8.7 | 7.3 | 9.8 |
| 2023 | 6.8 | 4.6 | 8.3 |
| 2024 | 5.9 | 2.6 | 8.3 |
| 2025 | 4.5 | 2.0 | 6.2 |
| 2026 | 3.7 | 2.0 | 4.9 |
After hitting a peak of 8.7% in 2022, global inflation is projected to fall to 5.9% in 2024, reflecting promising inflation trends amid resilient global growth.
While inflation has largely declined due to falling energy and goods prices, persistently high services inflation poses challenges to mitigating price pressures. In addition, the IMF highlights the potential risk of an escalating conflict in the Middle East, which could lead to energy price shocks and higher shipping costs.
These developments could negatively affect inflation scenarios and prompt central banks to adopt tighter monetary policies. Overall, by 2026, global inflation is anticipated to decline to 3.7%—still notably above the 2% target set by several major economies.
Adding to this, we can see divergences in the path of inflation between advanced and emerging economies. While affluent nations are forecast to see inflation edge closer to the 2% target by 2026, emerging economies are projected to have inflation rates reach 4.9%—falling closer to their pre-pandemic averages.
Get the Full Analysis of the IMF’s Outlook on VC+
This visual is part of an exclusive special dispatch for VC+ members which breaks down the key takeaways from the IMF’s 2024 World Economic Outlook.
For the full set of charts and analysis, sign up for VC+.

-

 Culture6 days ago
The World’s Top Media Franchises by All-Time Revenue
-

 Science2 weeks ago
Visualizing the Average Lifespans of Mammals
-

 Brands2 weeks ago
How Tech Logos Have Evolved Over Time
-

 Energy2 weeks ago
Ranked: The Top 10 EV Battery Manufacturers in 2023
-

 Demographics2 weeks ago
Countries With the Largest Happiness Gains Since 2010
-

 Economy2 weeks ago
VC+: Get Our Key Takeaways From the IMF’s World Economic Outlook
-

 Demographics2 weeks ago
The Countries That Have Become Sadder Since 2010
-

 Money1 week ago
Charted: Who Has Savings in This Economy?