


Japanese Yen Talking Points
USD/JPY appears to have reversed course ahead of the October 1998 high (136.89) as it extends the decline following the Federal Reserve interest rate decision, and recent developments in the Relative Strength Index (RSI) warn of a larger pullback in the exchange rate as the oscillator falls back from overbought territory to indicate a textbook sell signal.
USD/JPY Forecast: RSI Sell Signal Emerges Ahead of BoJ Rate Decision
USD/JPY seems to be tracking the weakness in US Treasury yields as it trades to a fresh weekly low (131.49), and the exchange rate may continue to carve a series of lower highs and lows over the coming days as Fed Chairman Jerome Powell tames speculation for a 100bp rate hike.

Looking it remains to be seen if the Bank of Japan (BoJ) interest rate decision will influence the exchange rate as the central bank is widely expected to retain the Quantitative and Qualitative Easing (QQE) program with Yield-Curve Control (YCC), and more of the same from Governor Haruhiko Kuroda and Co. may shore up USD/JPY amid the diverging paths for monetary policy.
As a result, the Japanese Yen may continue to weaken against its US counterpart in 2022 with the BoJ in no rush to switch gears, and the decline from the yearly high (135.59) may turn out of be a correction in the broader trend as the Federal Open Market Committee (FOMC) plans to implement higher interest rates over the coming months.
In turn, USD/JPY may continue to trade to multi-decade highs as Chairman Powell and Co. show a greater willingness to implement a restrictive policy, but the tilt in retail sentiment looks poised to persist as traders have been net-short the pair for the majority of 2022.
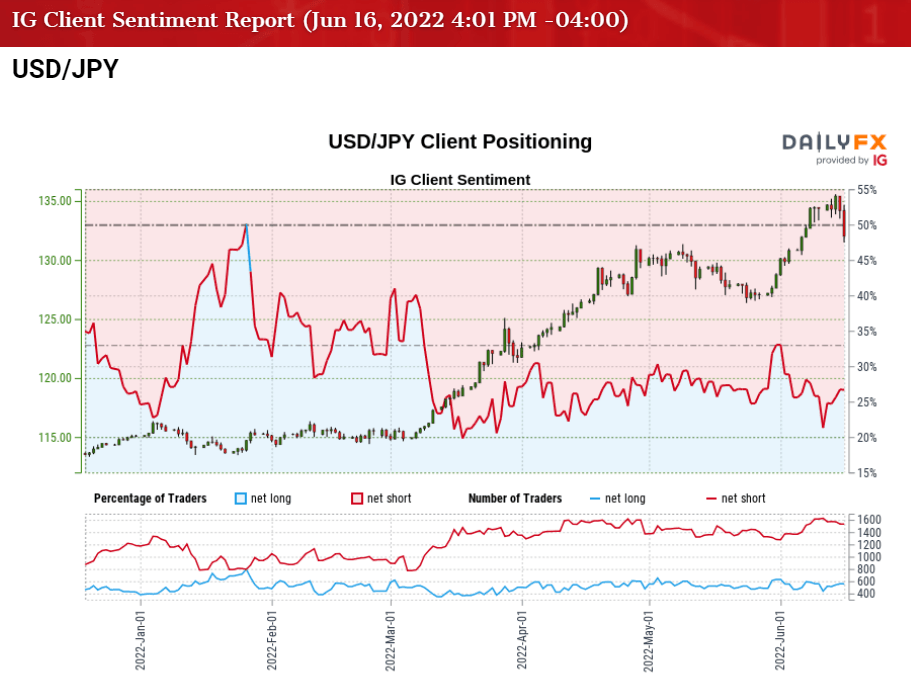
The IG Client Sentiment report shows only 24.06% of traders are currently net-long USD/JPY, with the ratio of traders short to long standing at 3.16 to 1.
The number of traders net-long is 28.53% lower than yesterday and 18.84% lower from last week, while the number of traders net-short is 7.97% lower than yesterday and 6.55% lower from last week. The decline in net-long position comes as USD/JPY trades to a fresh weekly low (131.49), while the drop in net-short interest has done little to alleviate the crowding behavior as 24.37% of traders were net-long the pair at the start of the week.
With that said, the diverging paths between the FOMC and BoJ is likely to keep USD/JPY afloat throughout 2022, but the failed attempt to test the October 1998 high (136.89) appears to be triggering a near-term correction in the exchange rate as the decline from the yearly high (135.59) pulls the RSI out of overbought territory.

USD/JPY Rate Daily Chart
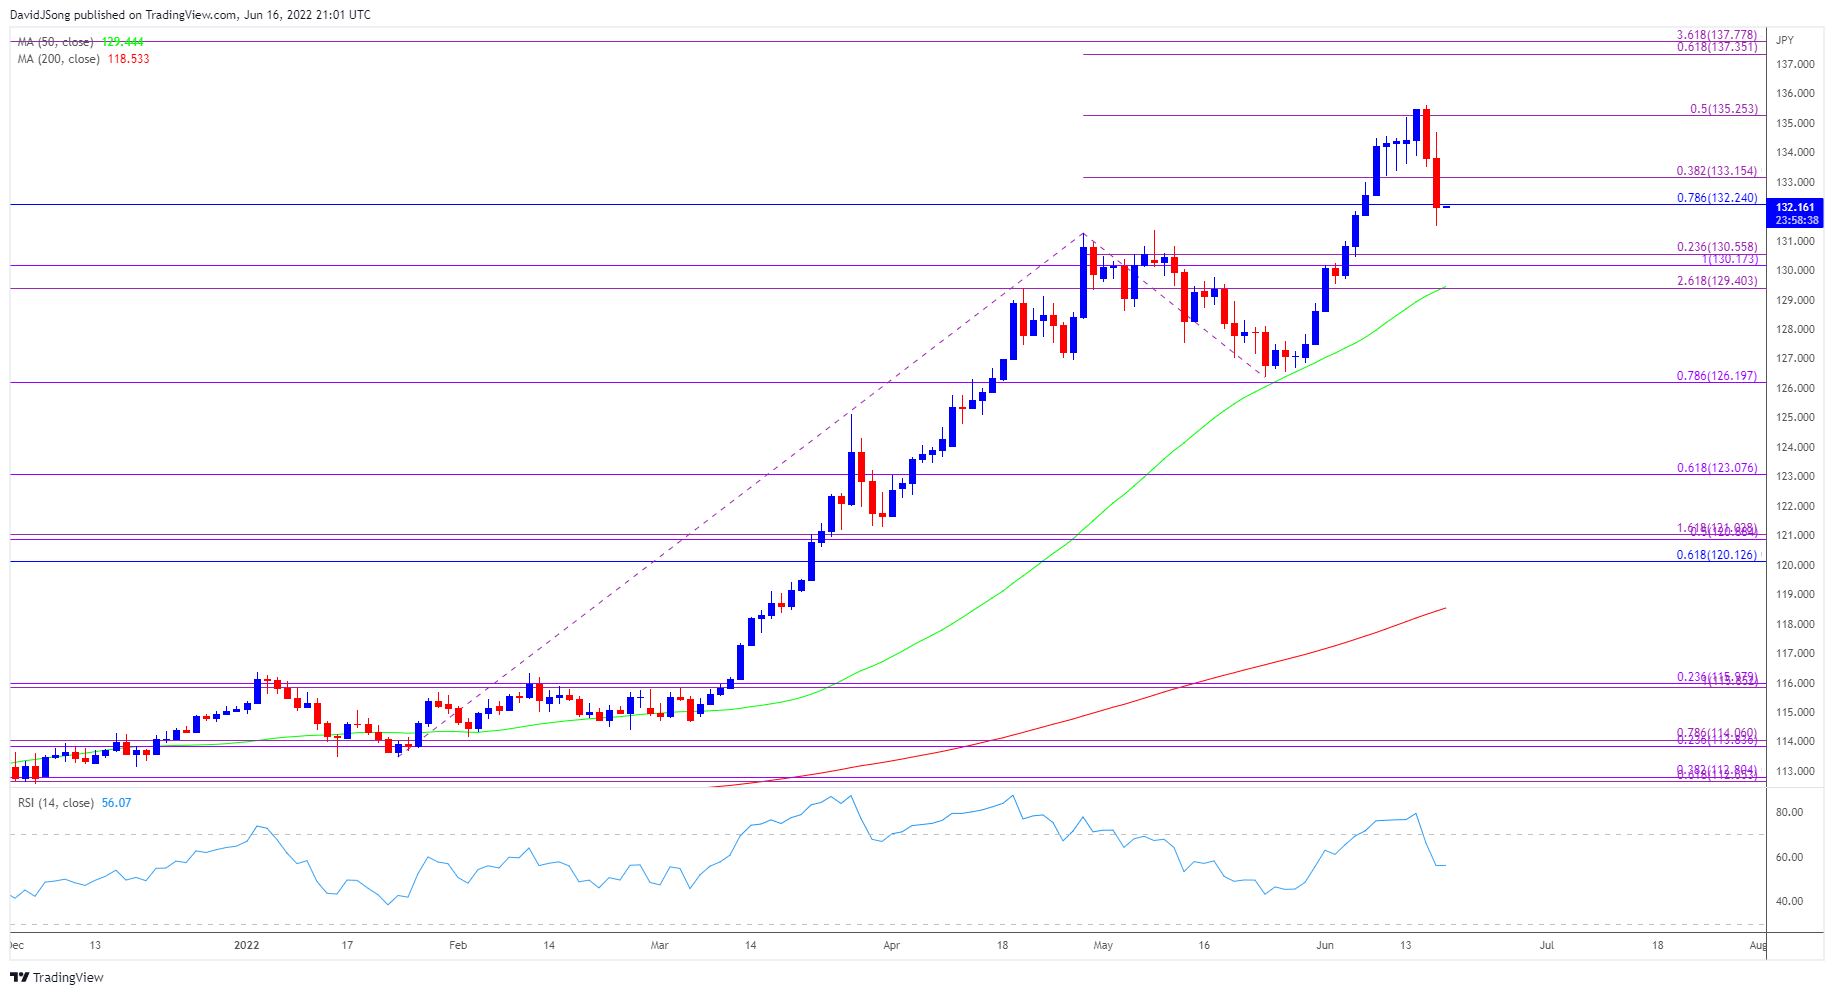
Source: Trading View
- Keep in mind, USD/JPY cleared the 2002 high (135.16) after finding support ahead of the 50-Day SMA (129.44) in May, but the exchange rate appears to have reversed course ahead of the October 1998 high (136.89) as the decline from the yearly high (135.59) pulls the Relative Strength Index (RSI) out of overbought territory.
- The move below 70 in the RSI is likely to be accompanied by a larger pullback in USD/JPY like the behavior seen earlier this year, with a break/close below the 130.20 (100% expansion) to 130.60 (23.6% expansion) area opening up the 129.40 (261.8% expansion) region, which largely lines up with the 50-Day SMA (129.44).
- It remains to be seen if USD/JPY will respond to the moving average as it continues to reflects a positive slope, with a break/close the 129.40 (261.8% expansion) region bringing the monthly low (128.60) on the radar.
- Nevertheless, the decline from the yearly high (135.59) may turn out to be a correction in the broader trend if it continues to hold above the 50-Day SMA (129.44), with a move above the Fibonacci overlap around 132.20 (78.6% retracement) to 133.20 (38.2% expansion) bringing the 135.30 (50% expansion) area back on the radar.

--- Written by David Song, Currency Strategist
Follow me on Twitter at @DavidJSong


