
Advertisement
Advertisement
U.S. Dollar Index (DX) Futures Technical Analysis – Strong Over 102.440, Weak Under 101.815 Ahead of GDP Data
By:
Trader reaction to 101.815 will likely determine the direction of the June U.S. Dollar Index on Wednesday.
In this article:
The U.S. Dollar is trading flat early Thursday after rising the previous session after minutes from the Federal Reserve’s May meeting showed that most participants believed half-percentage point rate increases would likely be appropriate in June and July.
All participants at the May 3-4 policy meeting backed the Fed’s 50-basis point rate increase this month to combat inflation they agreed had become a key threat to the economy’s performance and was at risk of accelerating without central bank action, the minutes of the session showed.
On Wednesday, the June U.S. Dollar Index settled at 102.077, up 0.207 or +0.20%. The Invesco DB US Dollar Index Bullish Fund ETF (UUP) closed at $27.30, up $0.09 or +0.33%.
There were no surprises in the Fed minutes. Although the Fed is expected to raise rates 50-basis points in June and July, policymakers are likely to keep an eye out for any major changes in the economy that could affect future rate hikes. These include inflation and job market data.
The Fed is likely to stay the course if it sees evidence of inflation peaking and the job market holding steady or improving. The Fed may have to get more aggressive if inflation continues to move higher. Job losses may force the Fed to re-evaluate how aggressive it can be.
On Thursday, dollar traders will get the opportunity to react to the Preliminary GDP and weekly unemployment claims reports.
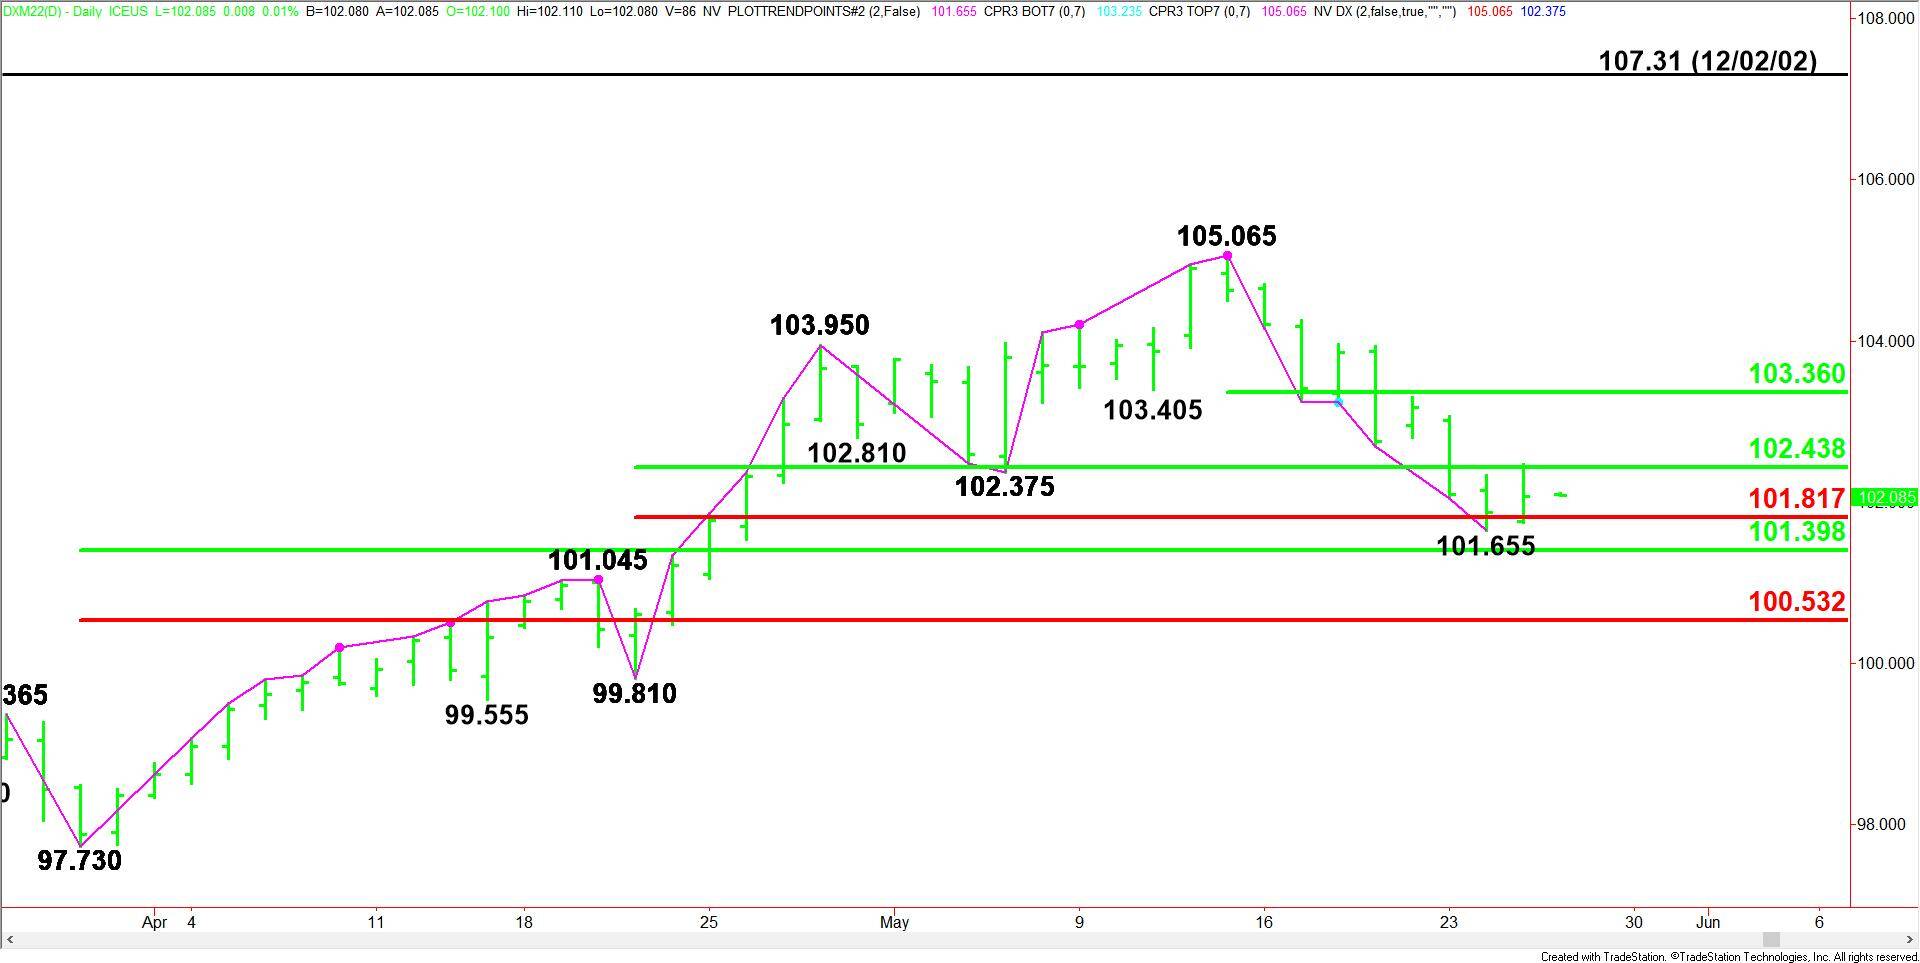
Daily Swing Chart Technical Analysis
The main trend is down according to the daily swing chart. A trade through 101.655 will signal a resumption of the downtrend. A move through 105.065 will change the main trend to up.
The short-term range is 99.810 to 105.065. The index is currently testing its retracement zone at 102.440 to 101.815.
The main range is 97.73 to 105.065. Its retracement zone at 101.400 to 100.530 is the key support area propping up prices.
The new minor range is 105.065 to 101.655. Its pivot at 103.360 is the nearest upside target.
Daily Swing Chart Technical Forecast
Trader reaction to 101.815 will likely determine the direction of the June U.S. Dollar Index on Wednesday.
Bullish Scenario
A sustained move over 101.815 will indicate the presence of buyers. This could lead to a test of 102.440. Overtaking this level will mean the buying is getting stronger. This could trigger an acceleration into the pivot at 103.360.
Bearish Scenario
A sustained move under 101.815 will signal the presence of sellers. Taking out the minor bottom should lead to a test of the 50% level at 101.400.
Look for a technical bounce on the first test of 101.400. If it fails as support then look for the selling to possibly extend into the main Fibonacci level at 100.530.
For a look at all of today’s economic events, check out our economic calendar.
About the Author
James Hyerczykauthor
James is a Florida-based technical analyst, market researcher, educator and trader with 35+ years of experience. He is an expert in the area of patterns, price and time analysis as it applies to futures, Forex, and stocks.
Did you find this article useful?
Latest news and analysis


Advertisement