


Japanese Yen, USD/JPY, US Dollar, Data - Talking Points
- USD/JPY made a 20-year high this week as uptrend continues
- The data shows that this move is an extremely rare event
- A lower JPY might be inevitable. Have officials adopted a lower Yen policy?
Introduction to Technical Analysis
Learn Technical Analysis
Recommended by Daniel McCarthy
The Japanese Yen has been consistently depreciating against the US Dollar since March 7th. Of the 43 days since then, including today, it has weakened every day except for 6, at the time of going to print. USD/JPY is currently at its highest level since May 2002.
For a deeper dive into the daily data that we have since 1980, we will be look at rolling 30-day periods. The New York close is 5pm local time there, Monday to Friday. The official FX market closes over the weekend.
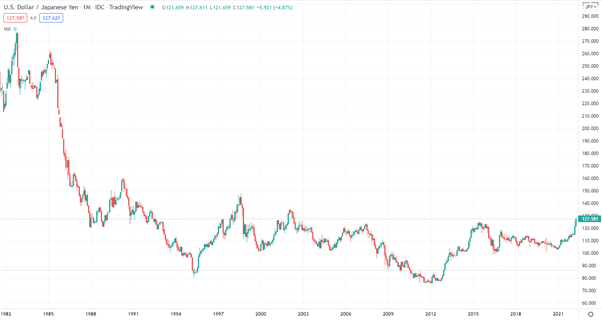
Over the 42-years of USD/JPY data, it stands to reason that, on average, there should be close to 15 up-days and 15 down-days. The data bears this out with 14.85 up-days. Over the 42 years, USD/JPY has moved from 240.30 to yesterdays close of 126.99.
The range over that period has seen a low New York close of 75.82 on October 10th, 2011, and a high close of 277.65 November 4th, 1982.
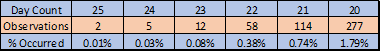
15,477 daily closes are in the dataset. Only twice since 1980 have there been 25 out of 30 up-days. They both occurred on the most recent Monday and Friday New York close. Needless to say, this a very rare event.
Looking at all occasions when 20 days or more out of 30 have been up-days, it has only occurred 277 times, or 1.79% of the time. Occurrences of 25 out of 30 up-days is unprecedented until now.
The backdrop to this scarce occurrence is a Japanese government and central bank that are comfortable with a depreciating Yen.
There has been a certain amount of jawboning from Japanese officials expressing concern of the rate of change and that exchange rates should reflect fundamentals. This is largely seen by the market as an attempt to avoid being singled out as currency manipulator by the US.
While the US Federal Reserve and many other central banks globally are in a tightening cycle, the Bank of Japan is maintaining extremely loose monetary policy. This is also playing a significant role in boosting USD/JPY in this unparalleled succession of up-days.
USD/JPY CHART – MONTHLY SINCE 1982

--- Written by Daniel McCarthy, Strategist for DailyFX.com
To contact Daniel, use the comments section below or @DanMcCathyFX on Twitter


