Print
Print My colleague Sam Millette, manager, fixed income on Commonwealth’s Investment Management and Research team, has helped me put together this month’s Economic Risk Factor Update. Thanks for the assist, Sam!
November had healthy levels of economic growth, with reports released during the month showing continued expansion. Business confidence continued to set record highs during the month and consumer confidence remains strong on a year-over-year basis, which should help support future business and consumer spending growth. One area worth noting, however, was the jobs report. While there was continued job growth, the headline number came in well below expectations. That said, this looks like an outlier, as upward revisions to previous months’ results offset some of the shortfall, while the household survey job growth came in much stronger.
On the medical side, risks increased during the month due to the discovery of the Omicron variant. But the impact from this new strain of the COVID-19 virus has been muted so far compared with the earlier Delta variant.
Given rising medical risks during the month and the slowdown in headline job creation, we’ve left the overall economic risk level at yellow for now; however, on the whole, the economic environment is much better than it was earlier in the year.
The Service Sector
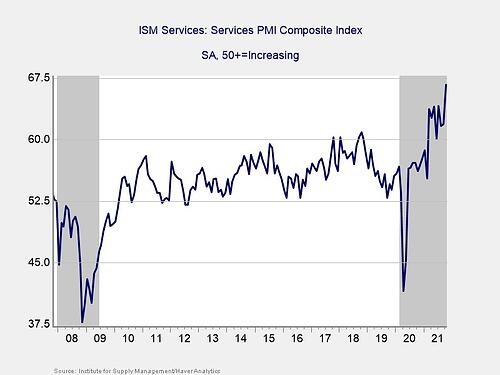
Signal: Green light
Service sector confidence continued to move higher in November, with a surprisingly large jump last month. The ISM Services index increased from 66.7 in October to 69.1 in November—the highest level on record. This is a diffusion index, where values above 50 indicate growth, so this result indicates accelerated growth for the service sector during the month.
As you can see in the chart above, service sector confidence remains well above the lows from initial lockdowns and pre-pandemic levels. Service sector confidence has been supported throughout the year by public health improvements and the associated easing of state and local restrictions that has reassured business owners of ongoing economic recovery. This better-than-expected result in November is especially encouraging given rising medical risks during the month, as it signals that service sector businesses are, in general, not yet concerned.
Given that service sector confidence improved during the month and sits at record levels, we have left this indicator at a green light for now.
Private Employment: Annual Change
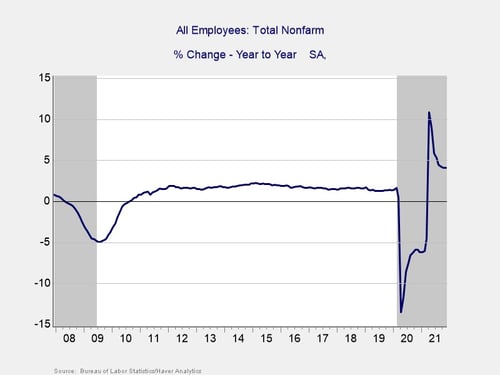
Signal: Yellow light
November’s employment report was disappointing at first glance, as 210,000 jobs were added against forecasts for 550,000 additional jobs. With that being said, the September and October reports were revised up by a combined 82,000 jobs, which blunts some of the initial disappointment with November’s headline job growth.
The underlying data was also stronger than the headline number suggests. The household survey showed a much larger increase in employment, resulting in the unemployment rate falling from 4.6 percent in October to 4.2 percent in November against calls for a more modest decline to 4.5 percent.
Despite the more solid underlying data, given the slowdown in headline job growth during the month, we have left this indicator at a yellow light for now. If we see a sustained rebound in the pace of hiring in the months ahead, this indicator may be set for an upgrade at some point next year.
Yield Curve (10-Year Minus 3-Month Treasury Rates)
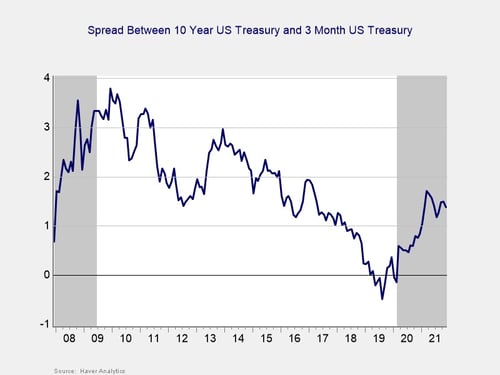
Signal: Green light
The yield curve flattened in November, breaking a three-month streak of widening. This result was due to falling long-term interest rates, as the 10-year Treasury yield fell from 1.55 percent at the end of October to 1.43 percent at the end of November. The three-month Treasury yield ended the month unchanged at 0.05 percent.
The drop in long-term Treasury yields was primarily due to rising investor concerns near month-end about the Omicron variant and its potential impact on the global economic recovery. Despite the decline during the month, long-term yields remain well above the pandemic-era lows we saw last year.
Given that long-term yields remain above 2020 lows and that the spread between 10-year and 3-month Treasury yields remains well outside the historical danger zone, we have kept this signal at a green light for now.
Consumer Confidence: Annual Change
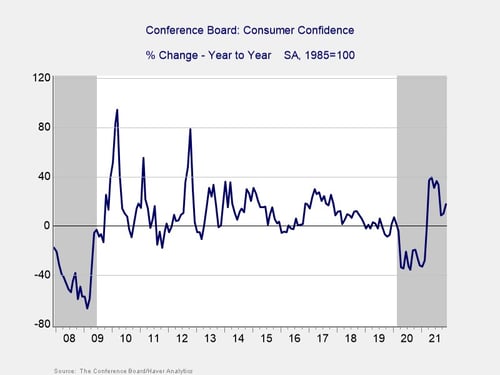
Signal: Green light
Consumer confidence declined modestly in November following a larger-than-expected increase in October. The Conference Board Consumer Confidence Index fell from a downwardly revised 111.6 in October to 109.5 in November. Despite the modest decline, the index still sits well above the 2021 low of 87.1 percent we saw in January, when the third wave of infection weighed heavily on sentiment.
On a year-over-year basis, confidence increased 17.9 percent in November, which is up from the 10 percent increase we saw in October.
Historically, declines in confidence of 20 percent or more over the past year are a signal of a recession; the fact that the growth rate remained positive and even increased in November was encouraging because it kept the year-over-year figure well outside the historical danger zone.
Since confidence remains well above lockdown-induced lows and outside the danger zone on a year-over-year basis, we have left this indicator at a green light for now. With that said, further declines in the months ahead could lead to a downgrade.
Conclusion: Economic Data Shows Continued Growth in November
The economic data releases in November largely showed faster growth for the economy despite concerns about the rise in medical risks and a weak employment report. Looking forward, continued growth remains the most likely path forward; however, as we’ve seen throughout the course of the pandemic, there are real risks that remain to this outlook.
The continued increase in hiring and solid consumer and service sector confidence during the month are good news but will need monitoring in the months ahead. Ultimately, the pace and path of the expected recovery in the short term remain uncertain, and therefore caution is still warranted.
We have left the overall economic risk indicator at a yellow light to reflect continued uncertainty and the potential for setbacks in the months ahead.