


Canadian Dollar Outlook:
- Oil prices are surging to fresh yearly highs, and now that Canadian federal elections are in the rearview mirror, the Loonie is able to follow.
- USD/CAD rates have breached consolidation support, while CAD/JPY rates recently touched a fresh yearly high.
- According to the IG Client Sentiment Index, USD/CAD rates have a mixed bias in the near-term.

Loonie Takes Flight
At the start of the month, it was noted that “now that October has arrived, and Canadian federal elections have passed, the Canadian Dollar is able to track more closely energy prices – and the BOC may be given leeway to resume its policy normalization efforts.”
Through the first two weeks of October, the Canadian Dollar has realized its bullish fundamental potential: surging oil prices (energy constitutes 11% of the Canadian economy) and better than expected Canadian economic data (the Citi Economic Surprise Index for Canada is up from +22.3 to +40 over the past month) have helped propel the Loonie higher. The bullish fundamental narrative has been reinforced, and the technical perspective looks supportive as well.
CAD/JPY Rate Technical Analysis: Daily Chart (October 2020 to October 2021) (Chart 1)

In the prior Canadian Dollar forecast, it was noted that “a bullish falling wedge has formed over the past six months…a run above the descending trendline from the October 2007 (all-time high) and December 2014 highs is in its early stages…a move above the 23.6% Fibonacci retracement of the 2021 low/high range at 88.68 would suggest gains towards the yearly high (91.19) is due this October.”
The measured move in bullish falling wedges calls for a return to the base (starting point) of the pattern, which was achieved earlier this week when CAD/JPY rates surged to a fresh yearly high at 91.41.
CAD/JPY rates are holding above their daily 5-, 8-, 13-, and 21-EMA envelope, which is in bullish sequential order. Daily MACD’s is advancing rapidly above its signal line, while daily Slow Stochastics are holding in overbought territory.
If anything, there could be a brief pause in bullish momentum now that the bullish falling wedge has been completed – but momentum indicators that, directionally, the bias remains higher.
USD/CAD Rate Technical Analysis: Daily Chart (October 2020 to October 2021) (Chart 2)
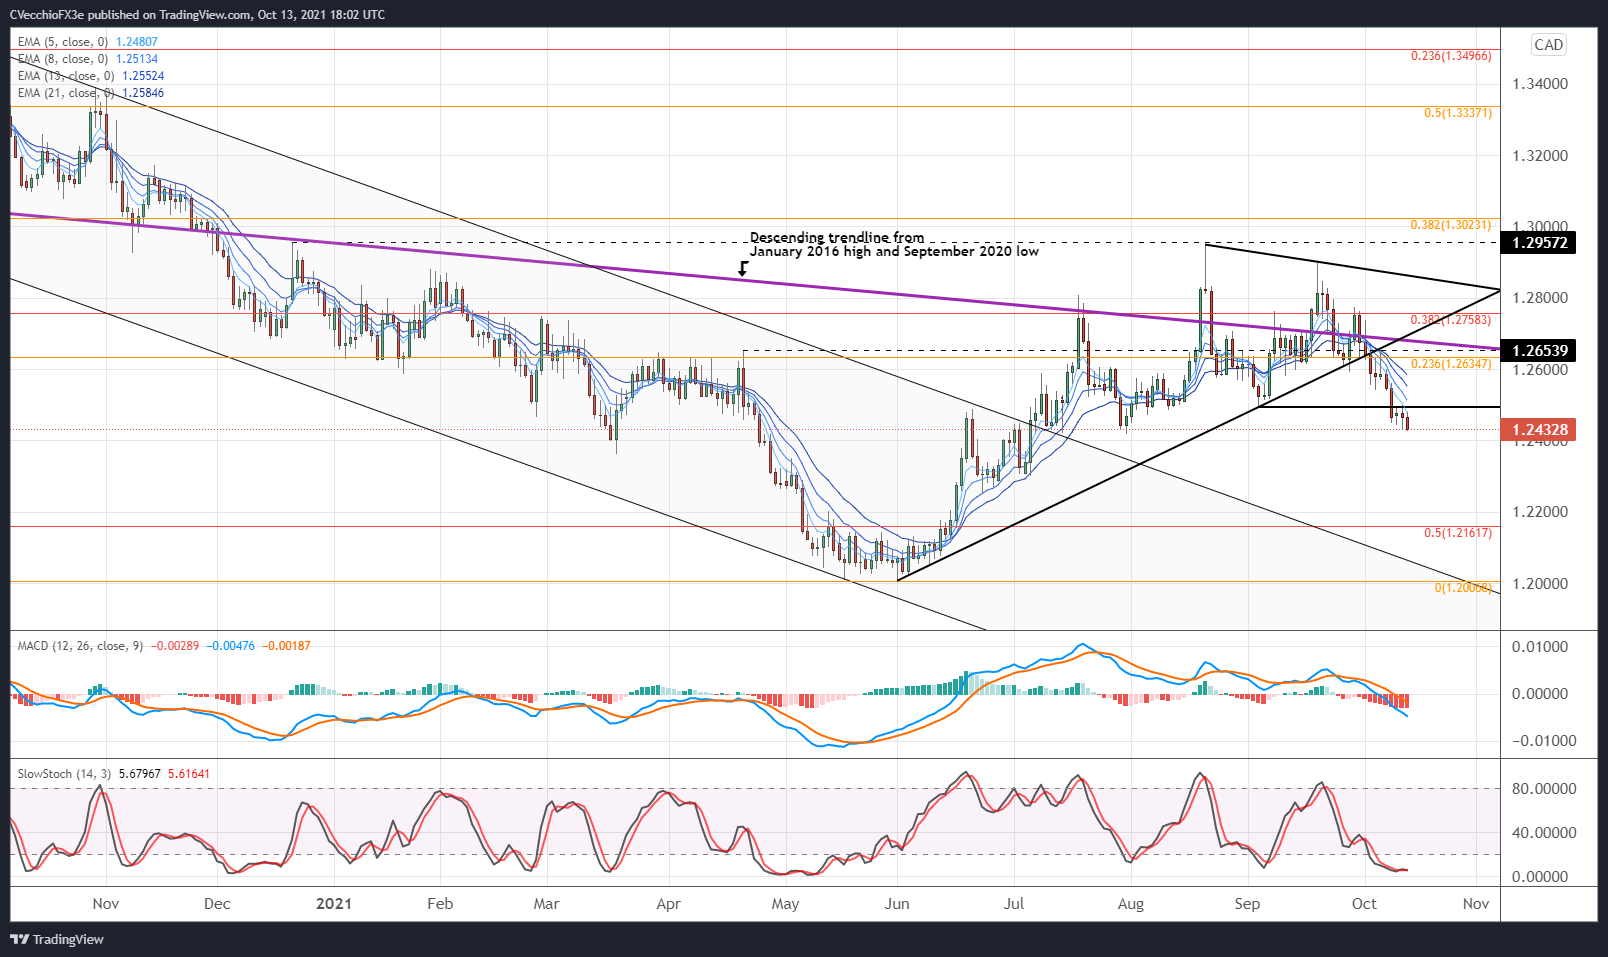
It was previously observed that “USD/CAD rates have been trading sideways for several weeks, but may finally be seeing a directional breakout…in losing the 23.6% Fibonacci retracement of the 2020 high/2021 low range at 1.2635, a more significant selloff may just be getting started.”
Indeed, USD/CAD rates departed the symmetrical triangle to the downside, all while holding below descending trendline from the January 2016 high and September 2020 low. In clearing out the September 2021 low, the uptrend that defined the middle part of this year has reversed.
Momentum continues to shift in a more bearish manner bearish as the breakout gathers pace. USD/CAD rates are below their daily EMA envelope, which is fully in bearish sequential order. Daily MACD’s drop below its signal line has continued, while daily Slow Stochastics are holding in oversold territory. Deeper losses should be anticipated over the coming weeks.

IG Client Sentiment Index: USD/CAD Rate Forecast (October 13, 2021) (Chart 3)

USD/CAD: Retail trader data shows 74.17% of traders are net-long with the ratio of traders long to short at 2.87 to 1. The number of traders net-long is 2.61% lower than yesterday and 19.29% higher from last week, while the number of traders net-short is 7.06% higher than yesterday and 1.09% lower from last week.
We typically take a contrarian view to crowd sentiment, and the fact traders are net-long suggests USD/CAD prices may continue to fall.
Positioning is less net-long than yesterday but more net-long from last week. The combination of current sentiment and recent changes gives us a further mixed USD/CAD trading bias.

--- Written by Christopher Vecchio, CFA, Senior Strategist


