Markets
Mapped: Distribution of Global GDP by Region
Mapped: The Distribution of Global GDP by Region
Gross domestic product (GDP) measures the value of goods and services that an economy produces in a given year, but in a global context, it is typically shown using country-level data.
As a result, we don’t often get to see the nuances of the global economy, such as how much specific regions and metro areas contribute to global GDP.
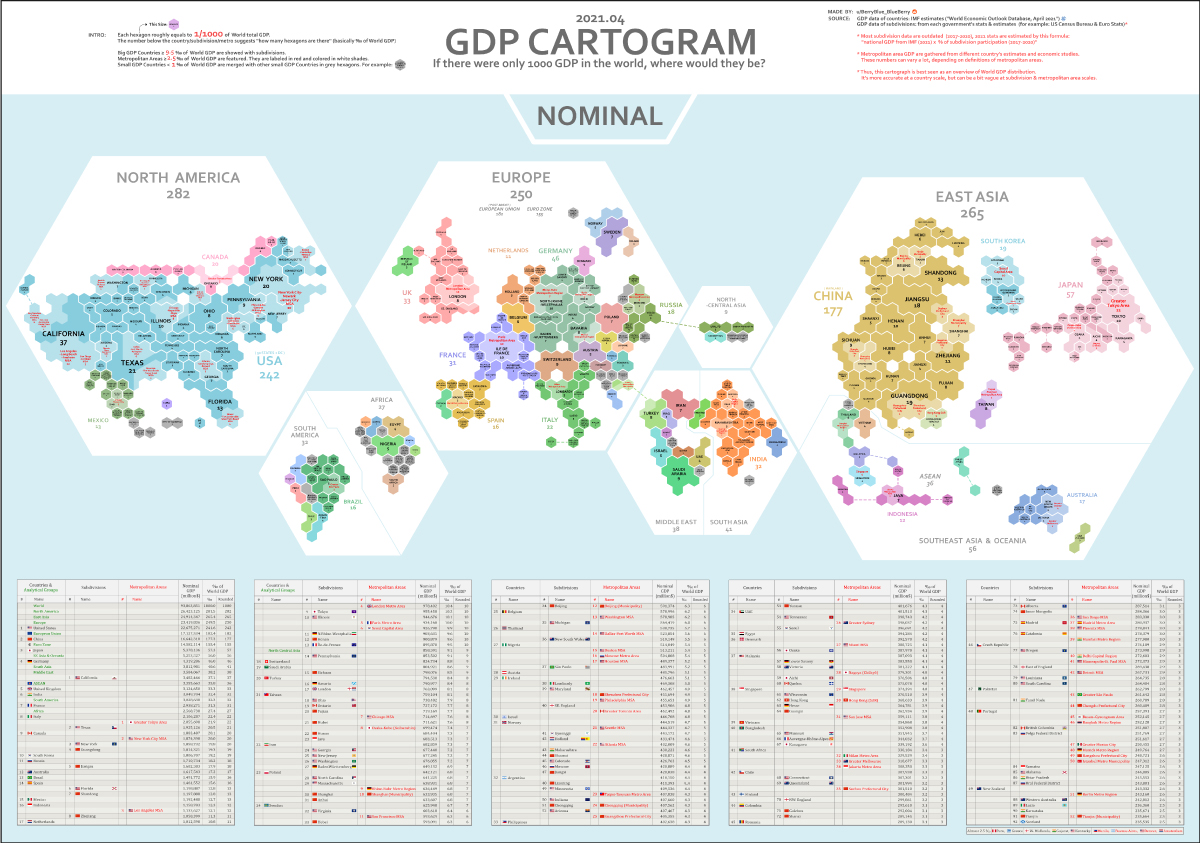
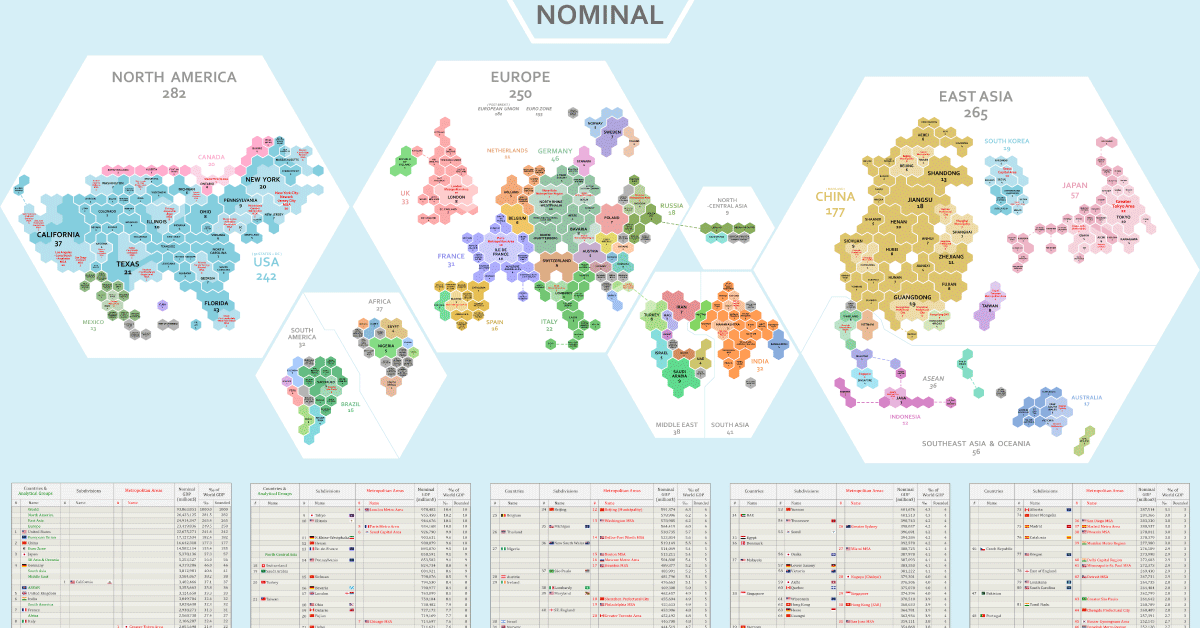
In these cartograms, global GDP has been normalized to a base number of 1,000 in order to show a more regional breakdown of economic activity. Created by Reddit user /BerryBlue_Blueberry, the two maps show the distribution in different ways: by nominal GDP and by GDP adjusted for purchasing power parity (PPP).
Methodology
Before diving in, let us give you some context on how these maps were designed. Each hexagon on the two maps represents 0.1% of the world’s overall GDP.
The number below each region, country or metropolitan area represents the number of hexagons covered by that entity. So in the nominal GDP map, the state of New York represents 20 hexagons (i.e. 2.0% of global GDP), while Munich’s metro area is 3 hexagons (0.3%).
Countries are further broken down based on size. Countries that make up more than 0.95% of global GDP are broken down into subdivisions, while countries that are smaller than 0.1% of GDP are grouped together. Metro areas that account for over 0.25% of global GDP are featured.
Finally, it should be noted that to account for some outdated subdivision participation data, the map creator calculated 2021 estimates for this using the formula: national GDP (2021) x % of subdivision participation (2017-2020).
Nominal vs. PPP
The above map is using nominal data, while the below map accounts for differences in purchasing power (PPP).
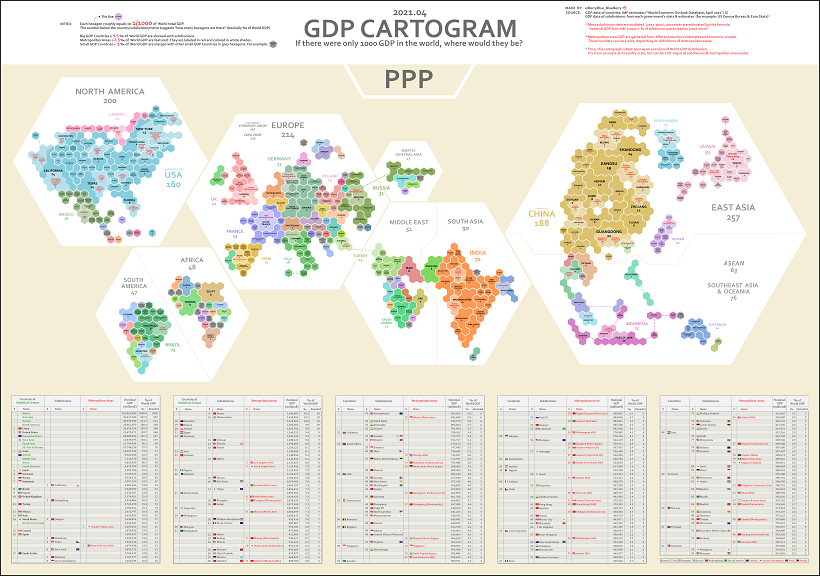
Adjusting for PPP takes into account the relative value of currencies and purchasing power in countries around the world. For example, $100 (or its exchange equivalent in Indian rupees) is generally going to be able to buy more in India than it is in the United States.
This is because goods and services are cheaper in India, meaning you can actually purchase more there for the same amount of money.
Anomalies in Global GDP Distribution
Breaking down global GDP distribution into cartograms highlights some interesting anomalies worth considering:
- North America, Europe, and East Asia, with a combined GDP of nearly $75 trillion, make up 80% of the world’s GDP in nominal terms.
- The U.S. State of California accounts for 3.7% of the world’s GDP by itself, which ranks higher than the United Kingdom’s total contribution of 3.3%.
- Canada as a country accounts for 2% of the world’s GDP, which is comparable to the GDP contribution of the Greater Tokyo Area at 2.2%.
- With a GDP of $3 trillion, India’s contribution overshadows the GDP of the whole African continent ($2.6 trillion).
- This visualization highlights the economic might of cities better than a conventional map. One standout example of this is in Ontario, Canada. The Greater Toronto Area completely eclipses the economy of the rest of the province.
Inequality of GDP Distribution
The fact that certain countries generate most of the world’s economic output is reflected in the above cartograms, which resize countries or regions accordingly.
Compared to wealthier nations, emerging economies still account for just a tiny sliver of the pie.
India, for example, accounts for 3.2% of global GDP in nominal terms, even though it contains 17.8% of the world’s population.
That’s why on the nominal map, India is about the same size as France, the United Kingdom, or Japan’s two largest metro areas (Tokyo and Osaka-Kobe)—but of course, these wealthier places have a far higher GDP per capita.


Investor Education
How MSCI Builds Thematic Indexes: A Step-by-Step Guide
From developing an index objective to choosing relevant stocks, this graphic breaks down how MSCI builds thematic indexes using examples.


How MSCI Builds Thematic Indexes: A Step-by-Step Guide
Have you ever wondered how MSCI builds its thematic indexes?
To capture long-term, structural trends that could drive business performance in the future, the company follows a systematic approach. This graphic from MSCI breaks down each step in the process used to create its thematic indexes.
Step 1: Develop an Index Objective
MSCI first builds a broad statement of what the theme aims to capture based on extensive research and insights from industry experts.
Steps 2 and 3: List Sub-Themes, Generate Keyword List
Together with experts, MSCI creates a list of sub-themes or “seedwords” to identify aligned business activities.
The team then assembles a collection of suitable documents describing the theme. Natural language processing efficiently analyzes word frequency and relevance to generate a more detailed set of keywords contextually similar to the seedwords.
Step 4: Find Relevant Companies
By analyzing financial reports, MSCI picks companies relevant to the theme using two methods:
- Direct approach: Revenue from a company’s business segment is considered 100% relevant if the segment name matches a theme keyword. Standard Industrial Classification (SIC) codes from these directly-matched segments make up the eligible SIC code list used in the indirect approach.
- Indirect approach: If a segment name doesn’t match theme keywords, MSCI will:
- Analyze the density of theme keywords mentioned in the company’s description. A minimum of two unique keywords is required.
- The keyword density determines a “discount factor” to reflect lower certainty in theme alignment.
- Revenue from business segments with an eligible SIC code, regardless of how they are named, is scaled down by the discount factor.
The total percentage of revenue applicable to the theme from both approaches determines a company’s relevance score.
Step 5: Select the Stocks
Finally, MSCI narrows down the stocks that will be included:
- Global parent universe: The ACWI Investable Market Index (IMI) is the starting point for standard thematic indexes.
- Relevance filter: The universe is filtered for companies with a relevance score of at least 25%.
- False positive control: Eligible companies that are mapped to un-related GICS sub-industries are removed.
Companies with higher relevance scores and market caps have a higher weighting in the index, with the maximum weighting for any one issuer capped at 5%. The final selected stocks span various sectors.
MSCI Thematic Indexes: Regularly Updated and Rules-Based
Once an index is built, it is reviewed semi-annually and updated based on:
- Changes to the parent index
- Changes at individual companies
- Theme developments based on expert input
Theme keywords are reviewed yearly in May. Overall, MSCI’s thematic index construction process is objective, scalable, and flexible. The process can be customized based on the theme(s) you want to capture.
Learn more about MSCI’s thematic indexes.

-

 Investor Education5 months ago
The 20 Most Common Investing Mistakes, in One Chart
Here are the most common investing mistakes to avoid, from emotionally-driven investing to paying too much in fees.
-

 Stocks10 months ago
Visualizing BlackRock’s Top Equity Holdings
BlackRock is the world’s largest asset manager, with over $9 trillion in holdings. Here are the company’s top equity holdings.
-

 Investor Education10 months ago
10-Year Annualized Forecasts for Major Asset Classes
This infographic visualizes 10-year annualized forecasts for both equities and fixed income using data from Vanguard.
-

 Investor Education1 year ago
Visualizing 90 Years of Stock and Bond Portfolio Performance
How have investment returns for different portfolio allocations of stocks and bonds compared over the last 90 years?
-

 Debt2 years ago
Countries with the Highest Default Risk in 2022
In this infographic, we examine new data that ranks the top 25 countries by their default risk.
-

 Markets2 years ago
The Best Months for Stock Market Gains
This infographic analyzes over 30 years of stock market performance to identify the best and worst months for gains.

-
 Money2 weeks ago
Visualizing the Growth of $100, by Asset Class (1970-2023)
-

 Money1 week ago
Where Does One U.S. Tax Dollar Go?
-

 Green2 weeks ago
Ranked: Top Countries by Total Forest Loss Since 2001
-

 Real Estate2 weeks ago
Visualizing America’s Shortage of Affordable Homes
-

 Maps2 weeks ago
Mapped: Average Wages Across Europe
-

 Mining2 weeks ago
Charted: The Value Gap Between the Gold Price and Gold Miners
-

 Demographics2 weeks ago
Visualizing the Size of the Global Senior Population
-

 Misc2 weeks ago
Tesla Is Once Again the World’s Best-Selling EV Company