

New Zealand Dollar, AUD/NZD, EUR/NZD, GBP/NZD – Talking Points
- AUD/NZD continuing lower off of head and shoulders pattern
- EUR/NZD remains weak, pair eyes March low below 1.65
- GBP/NZD under control of bears, possible bear flag forming

AUD/NZD Technical Analysis
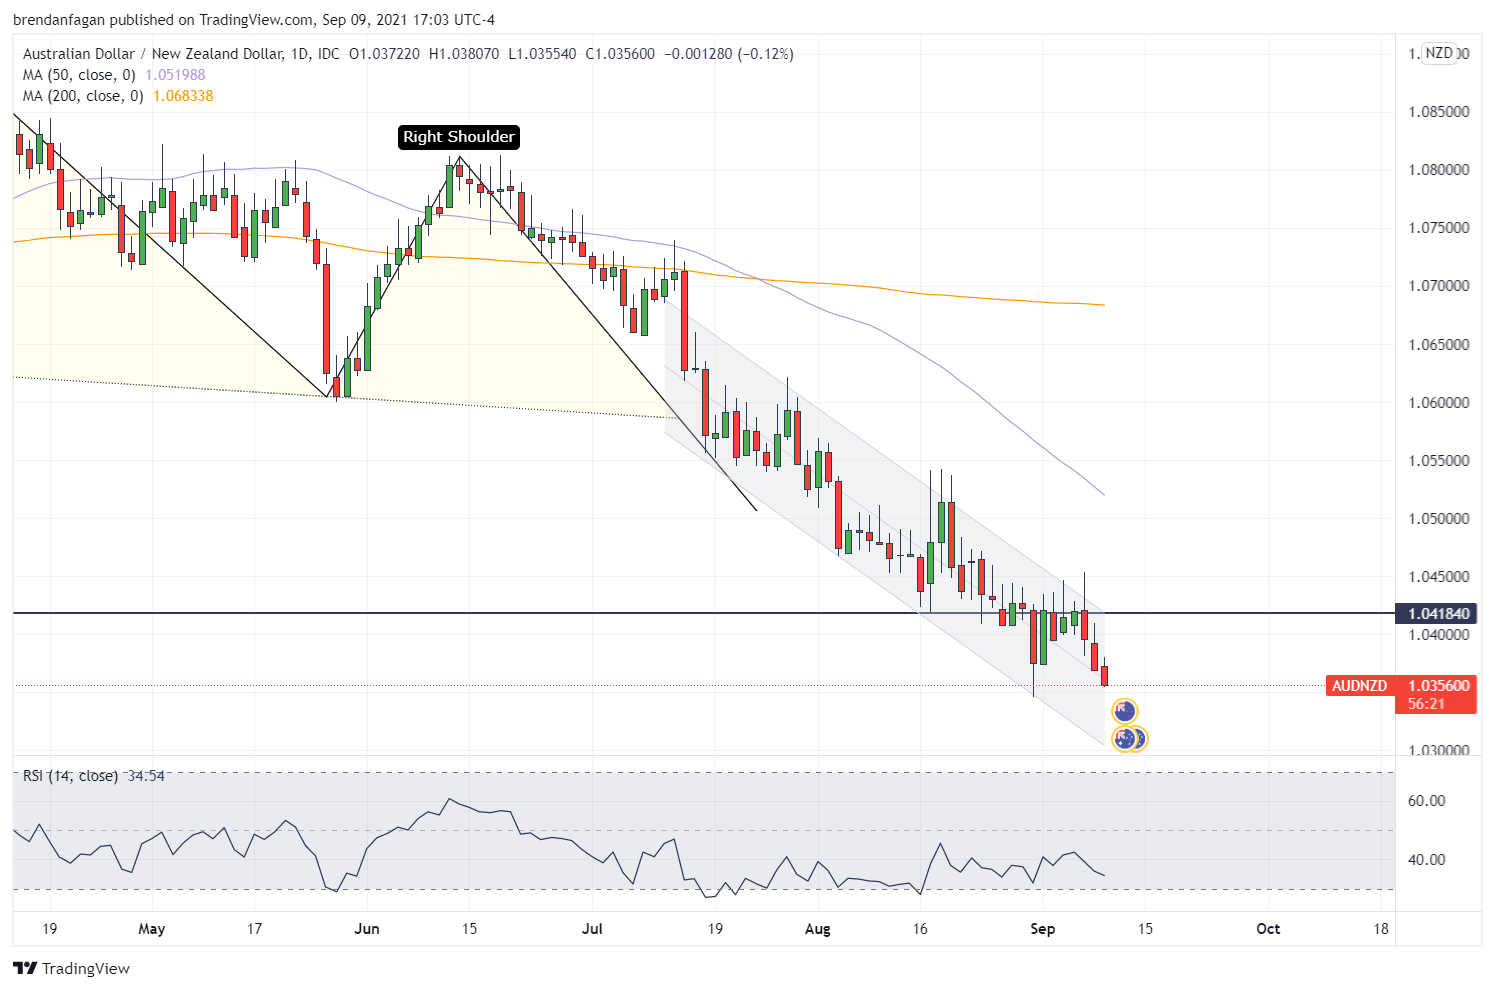
AUD/NZD bias remains skewed to the downside as bears continue to drive price action lower. Chop during the early months of 2021 saw the formation of a head and shoulders pattern, and the break lower from the right shoulder shows no signs of stopping. Relative strength for the pair has not popped above 50 since late June, as price continues to drive lower. The pair blew right through the December 2020 low at 1.04184, and retests of that low have since failed. With relative strength nearly non-existent and the cross below key moving averages, traders may look to see continuation to the current move. Traders may eye the April 2020 low of 1.0206 as the next key support level, should this move take another leg lower.
AUD/NZD Daily Chart
EUR/NZD Technical Analysis
EUR/NZD has made a sustained move lower as well, following a break of trendline support in late August. Range bound for months, EUR/NZD bears may look to the March low at 1.64867 for their next target. Declining relative strength along with an incoming death cross fails to paint a “rosy” picture for the pair. Any reversal in the pair could see a retest of the 50-day moving average (MA) or the 200-day MA. A clean break of the March swing low could potentially bring the yearly low into play at 1.63237.
EUR/NZD Daily Chart
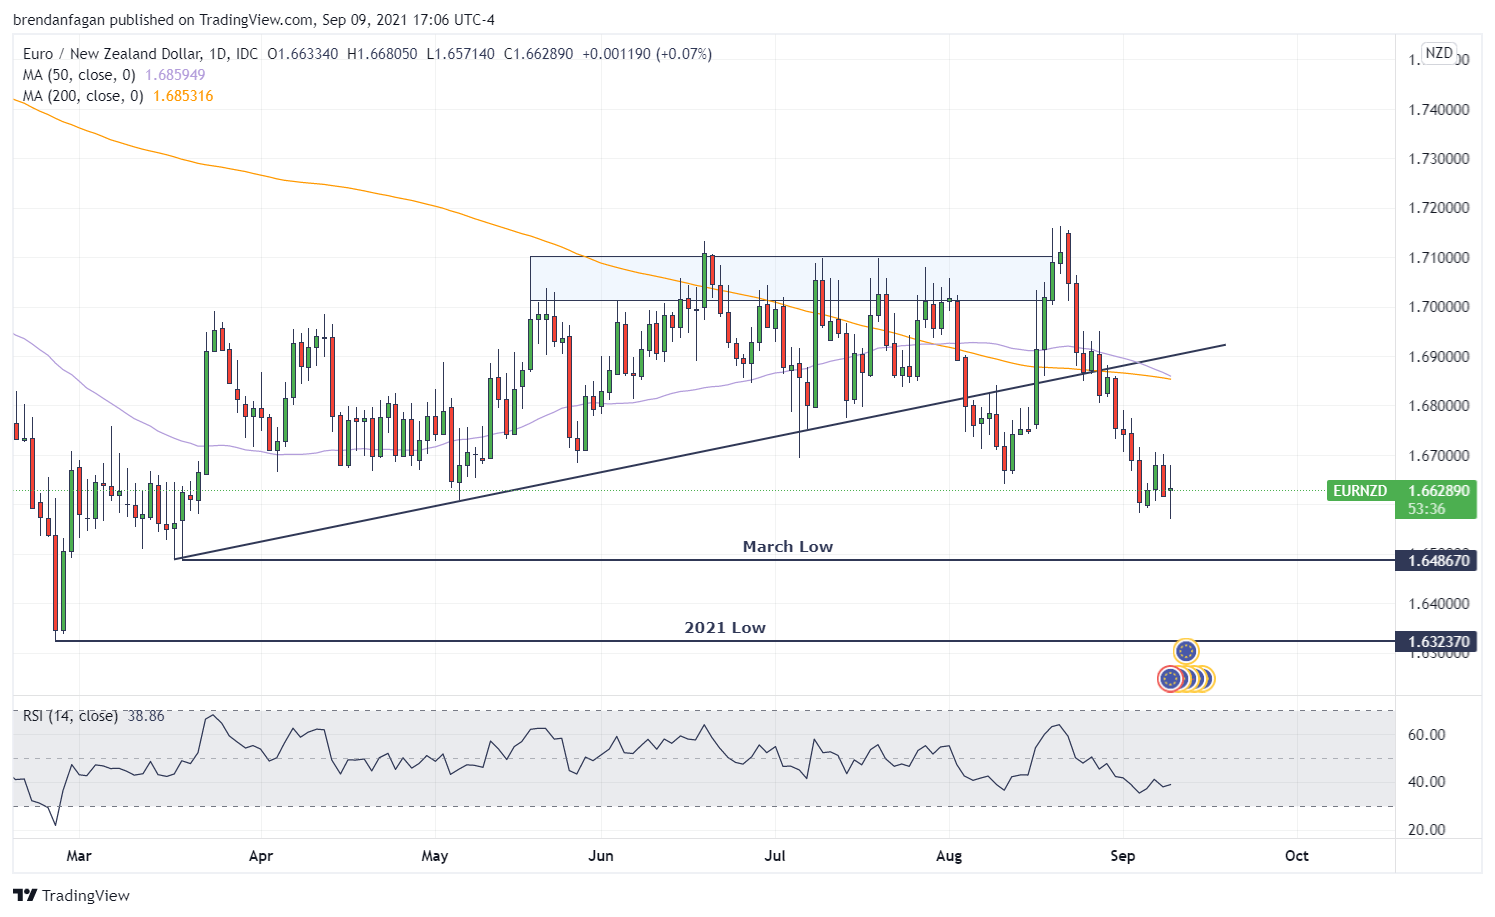
Chart created with TradingView

GBP/NZD Technical Analysis
From May through August, GBP/NZD found itself making multiple failed attempts to break above the key psychological 2.000 level. On each rejection, price was supported by an ascending trendline which was ultimately broken after the 4th failed attempt to breakout above 2.000. That break saw the pair trade through both the 50-day and 200-day moving averages in a swift move to the downside. Despite retaking the 200-day MA on Thursday, the formation of a bear flag appears to be taking shape, indicating that further declines may be in store in the near-term. Should a break lower materialize from the bear flag, market participants may look to the 1.9200 level for support, an area that provided strong support throughout April and May.
GBP/NZD Daily Chart
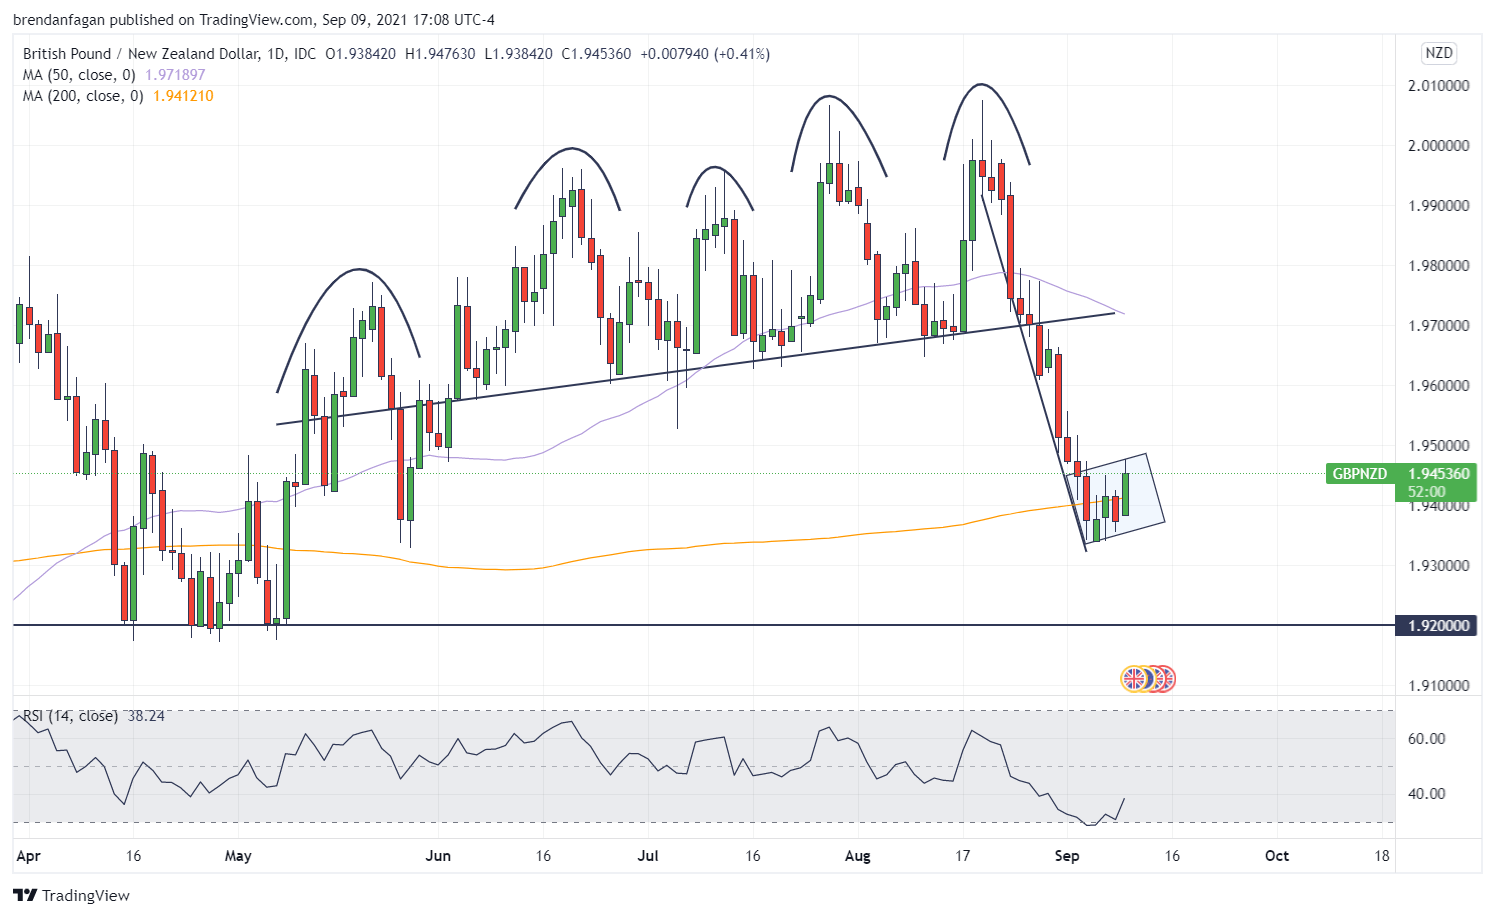
Chart created with TradingView
Resources for Forex Traders
Whether you are a new or experienced trader, we have several resources available to help you; indicator for tracking trader sentiment, quarterly trading forecasts, analytical and educational webinars held daily, trading guides to help you improve trading performance, and one specifically for those who are new to forex.
--- Written by Brendan Fagan, Intern
To contact Brendan, use the comments section below or @BrendanFaganFX on Twitter