Markets
Shapes of Recovery: When Will the Global Economy Bounce Back?
The Shape of Economic Recovery, According to CEOs
Is the glass half full, or half empty?
Whenever the economy is put through the ringer, levels of optimism and pessimism about its potential recovery can vary greatly. The current state mid-pandemic is no exception.
This graphic first details the various shapes that economic recovery can take, and what they mean. We then dive into which of the four scenarios are perceived the most likely to occur, based on predictions made by CEOs from around the world.
The ABCs of Economic Recovery
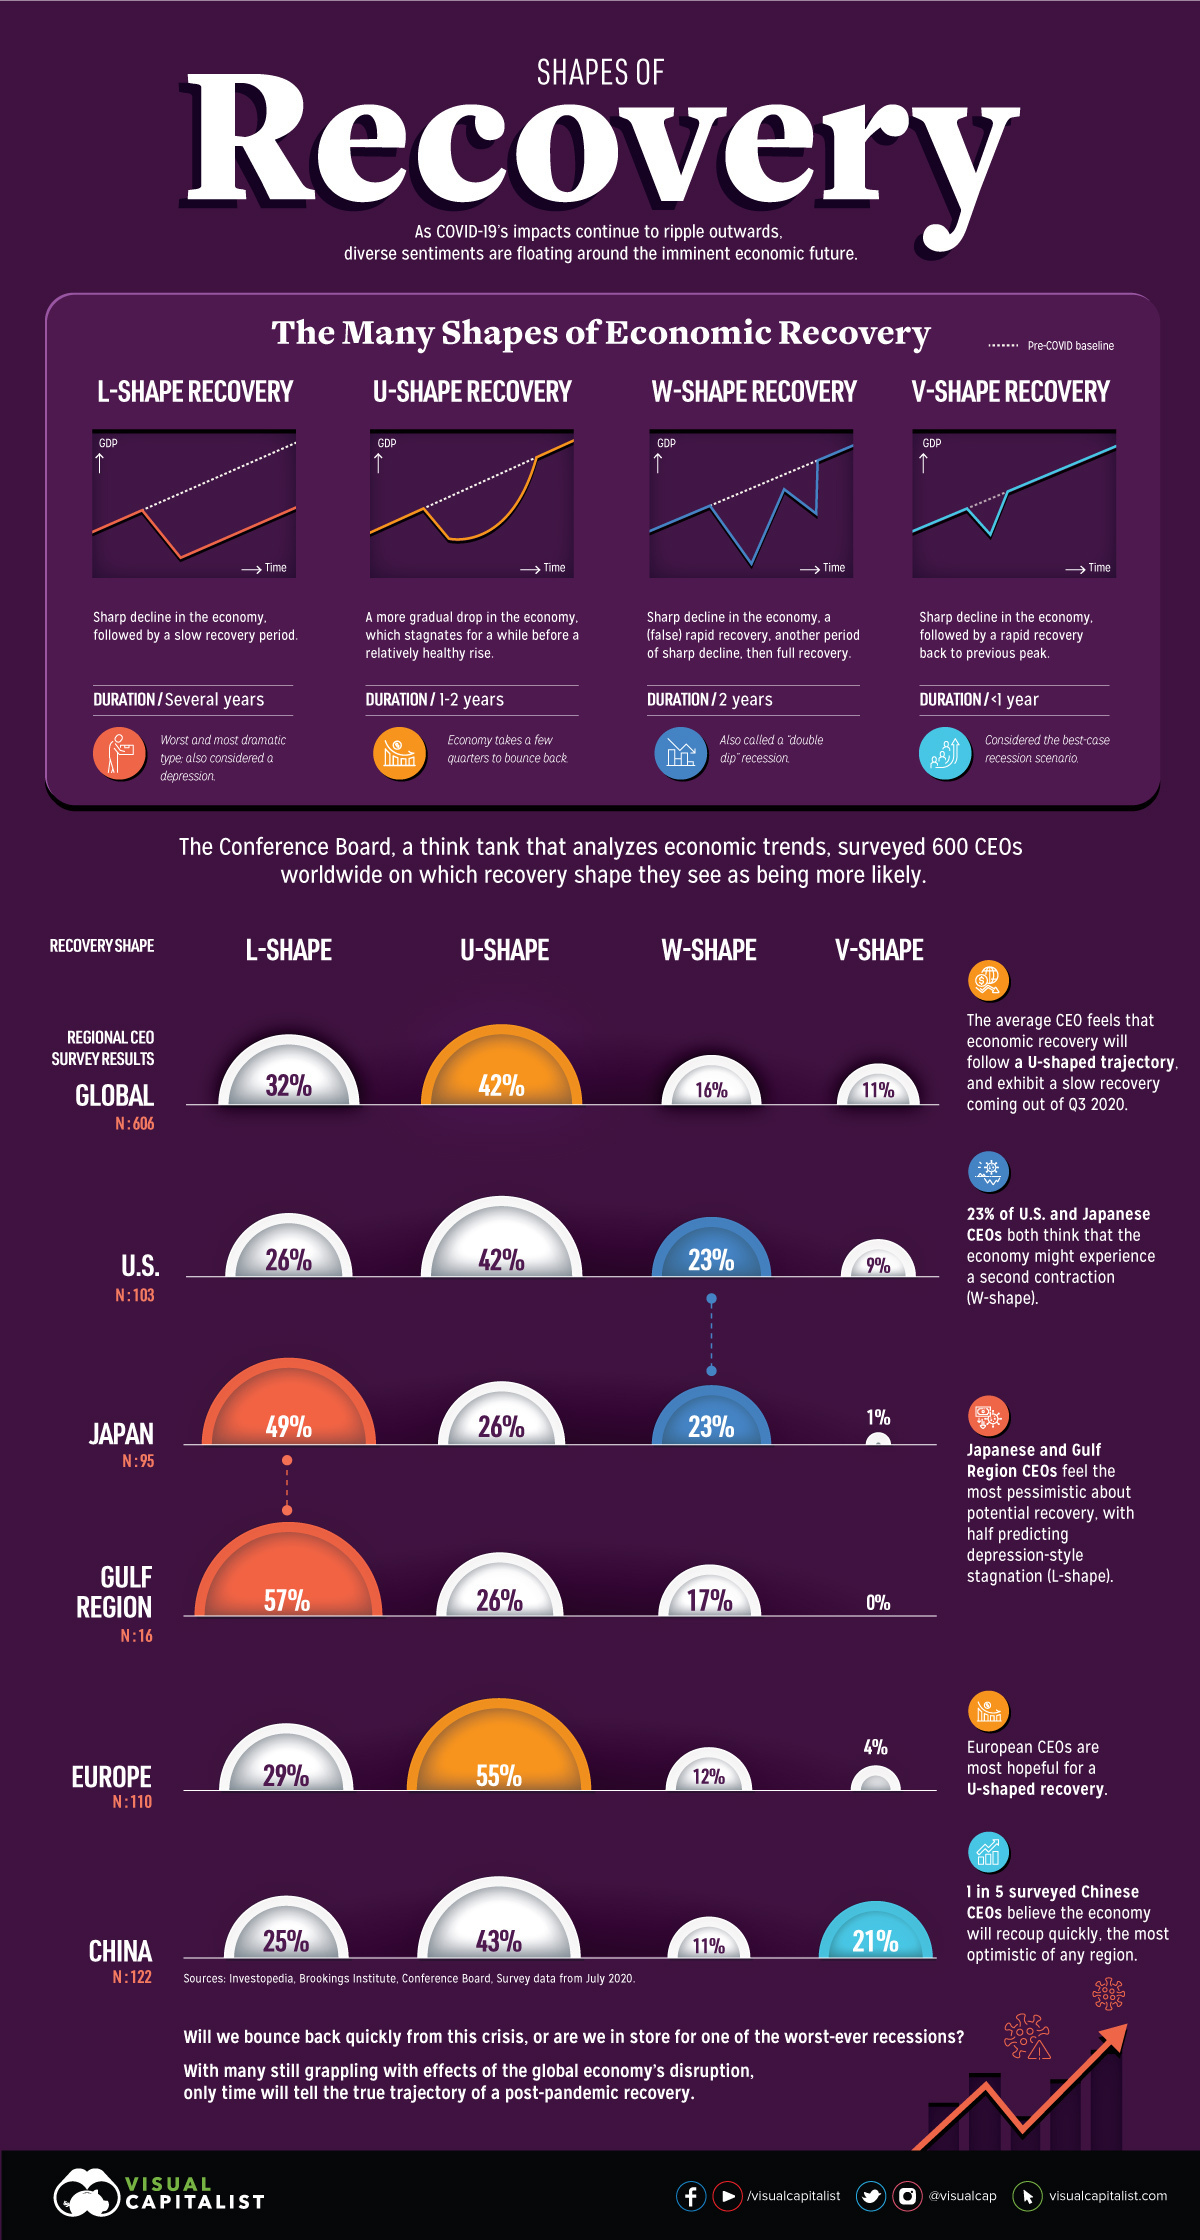
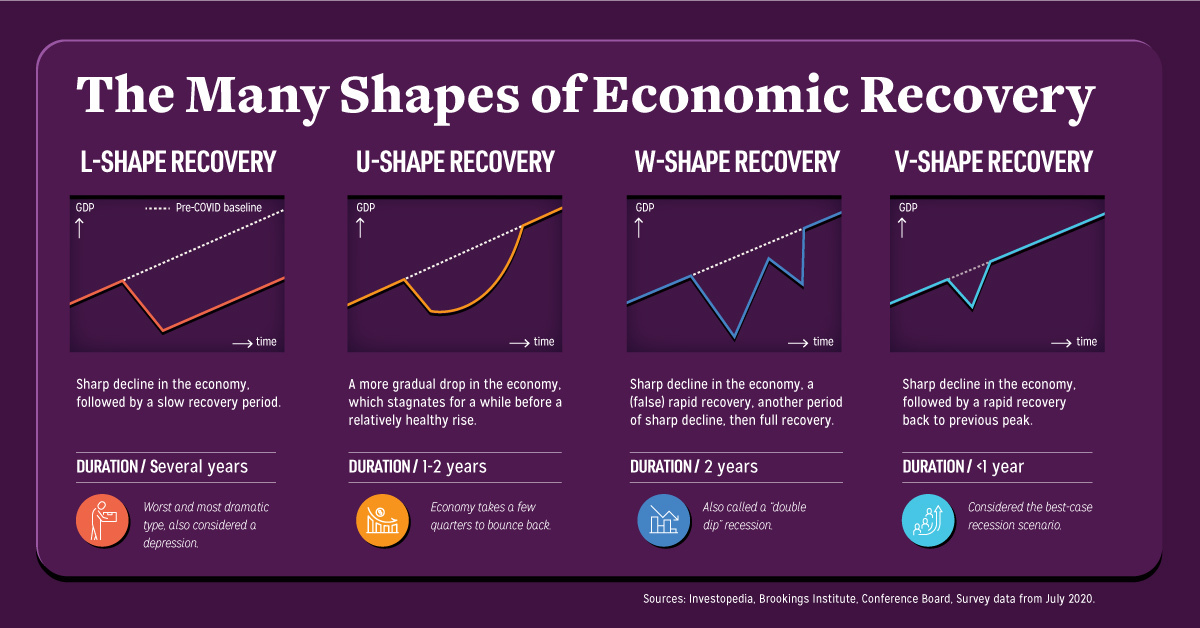
Economic recovery comes in four distinct shapes—L, U, W, and V. Here’s what each of these are characterized by, and how long they typically last.
- L-shape
This scenario exhibits a sharp decline in the economy, followed by a slow recovery period. It’s often punctuated by persistent unemployment, taking several years to recoup back to previous levels. - U-shape
Also referred to as the “Nike Swoosh” recovery, in this scenario the economy stagnates for a few quarters and up to two years, before experiencing a relatively healthy rise back to its previous peak. - W-shape
This scenario offers a tempting promise of recovery, dips back into a sharp decline, and then finally enters the full recovery period of up to two years. This is also known as a “double-dip recession“, similar to what was seen in the early 1980s. - V-shape
In this best-case scenario, the sharp decline in the economy is quickly and immediately followed by a rapid recovery back to its previous peak in less than a year, bolstered especially by economic measures and strong consumer spending.
Another scenario not covered here is the Z-shape, defined by a boom after pent-up demand. However, it doesn’t quite make the cut for the present pandemic situation, as it’s considered even more optimistic than a V-shaped recovery.
Depending on who you ask, the sentiments about a post-pandemic recovery differ greatly. So which of these potential scenarios are we really dealing with?
How CEOs Think The Economy Could Recover
The think tank The Conference Board surveyed over 600 CEOs worldwide, to uncover how they feel about the likelihood of each recovery shape playing out in the near future.
The average CEO felt that economic recovery will follow a U-shaped trajectory (42%), eventually exhibiting a slow recovery coming out of Q3 of 2020—a moderately optimistic view.
However, geography seems to play a part in these CEO estimates of how rapidly things might revert back to “normal”. Over half of European CEOs (55%) project a U-shaped recovery, which is significantly higher than the global average. This could be because recent COVID-19 hotspots have mostly shifted to other areas outside of the continent, such as the U.S., India, and Brazil.
Here’s how responses vary by region:
| Region | L-shape | U-shape | W-shape | V-shape |
|---|---|---|---|---|
| Global (N=606) | 32% | 42% | 16% | 11% |
| U.S. (N=103) | 26% | 42% | 23% | 9% |
| Europe (N=110) | 29% | 55% | 12% | 4% |
| China (N=122) | 25% | 43% | 11% | 21% |
| Japan (N=95) | 49% | 26% | 23% | 1% |
| Gulf Region (N=16) | 57% | 26% | 17% | - |
In the U.S. and Japan, 23% of CEOs expect a second contraction to occur, meaning that economic activity could undergo a W-shape recovery. Both countries have experienced quite the hit, but there are stark differences in their resultant unemployment rates—15% at its peak in the U.S., but a mere 2.6% in Japan.
In China, 21% of CEOs—or one in five—anticipate a quick, V-shaped recovery. This is the most optimistic outlook of any region, and with good reason. Although economic growth contracted by 6.8% in the first quarter, China has bounced back to a 3.2% growth rate in the second quarter.
Finally, Gulf Region CEOs feel the most pessimistic about potential economic recovery. In the face of an oil shock, 57% predict the economy will see an L-shaped recovery that could result in depression-style stagnation in years to come.
The Economic Recovery, According to Risk Analysts
At the end of the day, CEO opinions are all over the map on the potential shape of the economic recovery—and this variance likely stems from geography, cultural biases, and of course the status of their own individual countries and industries.
Despite this, portions of all cohorts saw some possibility of an extended and drawn-out recovery. Earlier in the year, risk analysts surveyed by the World Economic Forum had similar thoughts, projecting a prolonged recession as the top risk of the post-COVID fallout.
It remains to be seen whether this will ultimately indeed be the trajectory we’re in store for.


Markets
Mapped: Europe’s GDP Per Capita, by Country
Which European economies are richest on a GDP per capita basis? This map shows the results for 44 countries across the continent.


Mapped: Europe’s GDP Per Capita, by Country (2024)
This was originally posted on our Voronoi app. Download the app for free on iOS or Android and discover incredible data-driven charts from a variety of trusted sources.
Europe is home to some of the largest and most sophisticated economies in the world. But how do countries in the region compare with each other on a per capita productivity basis?
In this map, we show Europe’s GDP per capita levels across 44 nations in current U.S. dollars. Data for this visualization and article is sourced from the International Monetary Fund (IMF) via their DataMapper tool, updated April 2024.
Europe’s Richest and Poorest Nations, By GDP Per Capita
Luxembourg, Ireland, and Switzerland, lead the list of Europe’s richest nations by GDP per capita, all above $100,000.
| Rank | Country | GDP Per Capita (2024) |
|---|---|---|
| 1 | 🇱🇺 Luxembourg | $131,380 |
| 2 | 🇮🇪 Ireland | $106,060 |
| 3 | 🇨🇭 Switzerland | $105,670 |
| 4 | 🇳🇴 Norway | $94,660 |
| 5 | 🇮🇸 Iceland | $84,590 |
| 6 | 🇩🇰 Denmark | $68,900 |
| 7 | 🇳🇱 Netherlands | $63,750 |
| 8 | 🇸🇲 San Marino | $59,410 |
| 9 | 🇦🇹 Austria | $59,230 |
| 10 | 🇸🇪 Sweden | $58,530 |
| 11 | 🇧🇪 Belgium | $55,540 |
| 12 | 🇫🇮 Finland | $55,130 |
| 13 | 🇩🇪 Germany | $54,290 |
| 14 | 🇬🇧 UK | $51,070 |
| 15 | 🇫🇷 France | $47,360 |
| 16 | 🇦🇩 Andorra | $44,900 |
| 17 | 🇲🇹 Malta | $41,740 |
| 18 | 🇮🇹 Italy | $39,580 |
| 19 | 🇨🇾 Cyprus | $37,150 |
| 20 | 🇪🇸 Spain | $34,050 |
| 21 | 🇸🇮 Slovenia | $34,030 |
| 22 | 🇪🇪 Estonia | $31,850 |
| 23 | 🇨🇿 Czech Republic | $29,800 |
| 24 | 🇵🇹 Portugal | $28,970 |
| 25 | 🇱🇹 Lithuania | $28,410 |
| 26 | 🇸🇰 Slovakia | $25,930 |
| 27 | 🇱🇻 Latvia | $24,190 |
| 28 | 🇬🇷 Greece | $23,970 |
| 29 | 🇭🇺 Hungary | $23,320 |
| 30 | 🇵🇱 Poland | $23,010 |
| 31 | 🇭🇷 Croatia | $22,970 |
| 32 | 🇷🇴 Romania | $19,530 |
| 33 | 🇧🇬 Bulgaria | $16,940 |
| 34 | 🇷🇺 Russia | $14,390 |
| 35 | 🇹🇷 Türkiye | $12,760 |
| 36 | 🇲🇪 Montenegro | $12,650 |
| 37 | 🇷🇸 Serbia | $12,380 |
| 38 | 🇦🇱 Albania | $8,920 |
| 39 | 🇧🇦 Bosnia & Herzegovina | $8,420 |
| 40 | 🇲🇰 North Macedonia | $7,690 |
| 41 | 🇧🇾 Belarus | $7,560 |
| 42 | 🇲🇩 Moldova | $7,490 |
| 43 | 🇽🇰 Kosovo | $6,390 |
| 44 | 🇺🇦 Ukraine | $5,660 |
| N/A | 🇪🇺 EU Average | $44,200 |
Note: Figures are rounded.
Three Nordic countries (Norway, Iceland, Denmark) also place highly, between $70,000-90,000. Other Nordic peers, Sweden and Finland rank just outside the top 10, between $55,000-60,000.
Meanwhile, Europe’s biggest economies in absolute terms, Germany, UK, and France, rank closer to the middle of the top 20, with GDP per capitas around $50,000.
Finally, at the end of the scale, Eastern Europe as a whole tends to have much lower per capita GDPs. In that group, Ukraine ranks last, at $5,660.
A Closer Look at Ukraine
For a broader comparison, Ukraine’s per capita GDP is similar to Iran ($5,310), El Salvador ($5,540), and Guatemala ($5,680).
According to experts, Ukraine’s economy has historically underperformed to expectations. After the fall of the Berlin Wall, the economy contracted for five straight years. Its transition to a Western, liberalized economic structure was overshadowed by widespread corruption, a limited taxpool, and few revenue sources.
Politically, its transformation from authoritarian regime to civil democracy has proved difficult, especially when it comes to institution building.
Finally, after the 2022 invasion of the country, Ukraine’s GDP contracted by 30% in a single year—the largest loss since independence. Large scale emigration—to the tune of six million refugees—is also playing a role.
Despite these challenges, the country’s economic growth has somewhat stabilized while fighting continues.

-

 Healthcare5 days ago
Life Expectancy by Region (1950-2050F)
-

 Economy2 weeks ago
Ranked: The Top 20 Countries in Debt to China
-

 Politics2 weeks ago
Charted: Trust in Government Institutions by G7 Countries
-

 Energy2 weeks ago
Mapped: The Age of Energy Projects in Interconnection Queues, by State
-

 Mining2 weeks ago
Visualizing Global Gold Production in 2023
-

 Markets1 week ago
Visualized: Interest Rate Forecasts for Advanced Economies
-

 Economy1 week ago
The Most Valuable Companies in Major EU Economies
-

 Markets1 week ago
The World’s Fastest Growing Emerging Markets (2024-2029 Forecast)