


Dow Jones, S&P 500, Nasdaq Composite, AUD/USD, Peter Navarro, Trade Wars - Talking Points
- Dow Jones, S&P 500 futures, AUD/USD sink on initial fears of trade deal breakdown
- Peter Navarro pulls 180, Donald Trump clarifies the phase-one trade deal is intact
- What is the technical road ahead for Dow Jones futures and the Australian Dollar?
Dow Jones, S&P 500 and Nasdaq Composite futures initially turned sharply lower in Asia Tuesday morning trade as risk aversion engulfed financial markets. In an interview with Fox News, White House Trade Adviser Peter Navarro said that the trade deal with China is “over”. Mr Navarro linked this stark assessment to Beijing's handling of the coronavirus outbreak, something that President Donald Trump has widely condemned.
Develop the discipline and objectivity you need to improve your approach to trading consistently
The sentiment-linked Australian Dollar and New Zealand Dollars declined at first and Dow Jones futures slipped over 1.4 percent at one point. This is as the haven-oriented US Dollar and anti-risk Japanese Yen capitalized on traders shifting to prioritizing liquidity over seeking returns. Growth-linked crude oil prices also followed lower as anti-fiat gold prices traded sideways, balancing conflicting cues as Treasury yields declined but the USD gained.
US-China relations were souring prior to this headline, particularly over Beijing’s seemingly tighter grip over Hong Kong. Fears of a breakdown in the phase-one trade deal may raise the risk of tit-for-tat tariff escalation between the two. This would consequentially add further uncertainty to the outlook for global growth.
Peter Navarro Makes a 180, Donald Trump Clarifies
However, about half an hour later, Peter Navarro walked back his initial statement. He clarified, saying that the comment on China was ‘taken wildly out of context’. His initial points were ‘not about the phase-one deal, which remains in place’. Moreover, he claimed to be speaking about a broad lack of trust between the US and China. Risk appetite recovered, reversing most of the initial risk-off surge.
President Donald Trump then clarified further that the trade deal is ‘fully intact’, erasing fears of a breakdown as sentiment fully recovered (at the time of writing).
S&P 500 Futures, AUD/USD, US Dollar, Japanese Yen Reaction to Navarro Comments
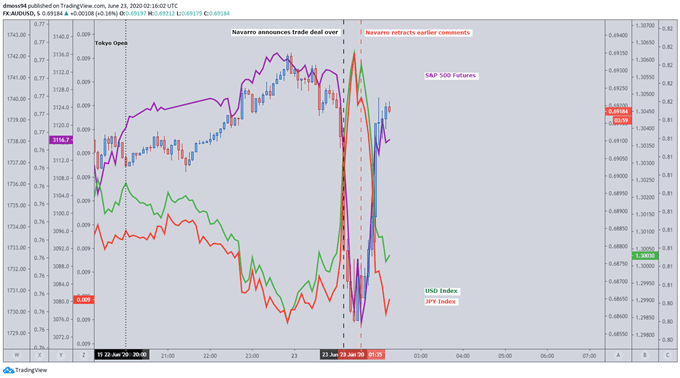
-Chart Courtesy of Analyst Daniel Moss, Follow Him on Twitter @DanielGMoss
Dow Jones Technical Analysis
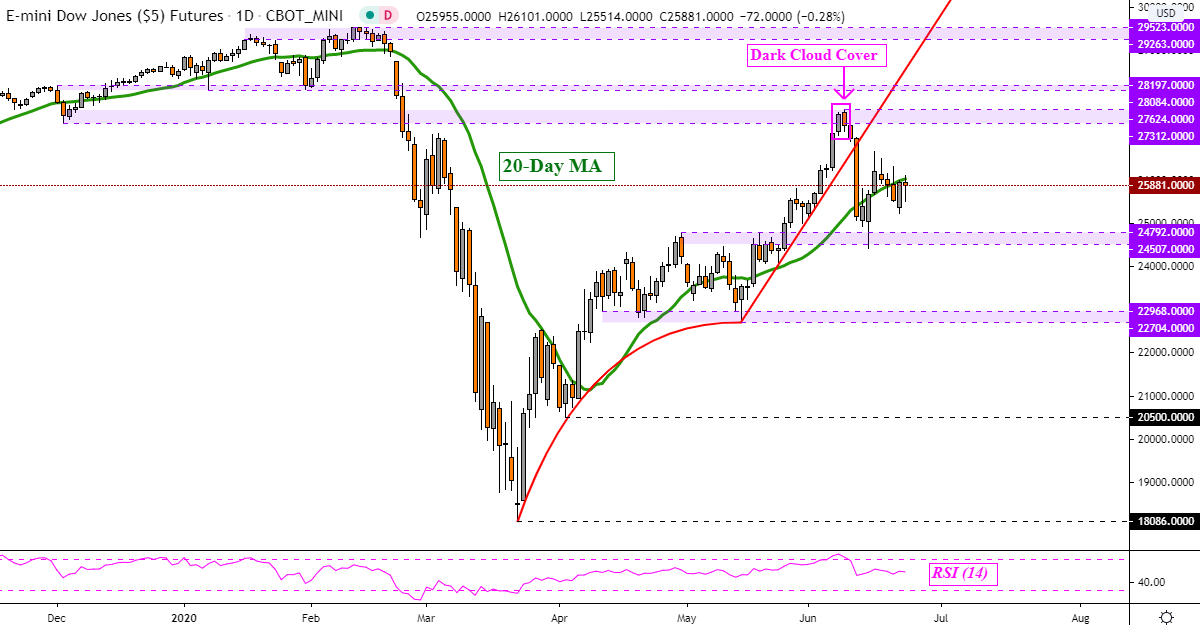
Dow Jones futures remain in a consolidative setting after prices first topped at the 27312 – 27624 inflection area, and then bounced off the 24507 – 24792 zone on the daily chart below. Prices are now testing the 20-day moving average and a confirmed downside close with follow-through could raise the risk of a broader reversal. That may place the focus on immediate support.
| Change in | Longs | Shorts | OI |
| Daily | -12% | 11% | 3% |
| Weekly | -20% | 19% | 4% |
Dow Jones Futures - Daily Chart
Australian Dollar Technical Analysis
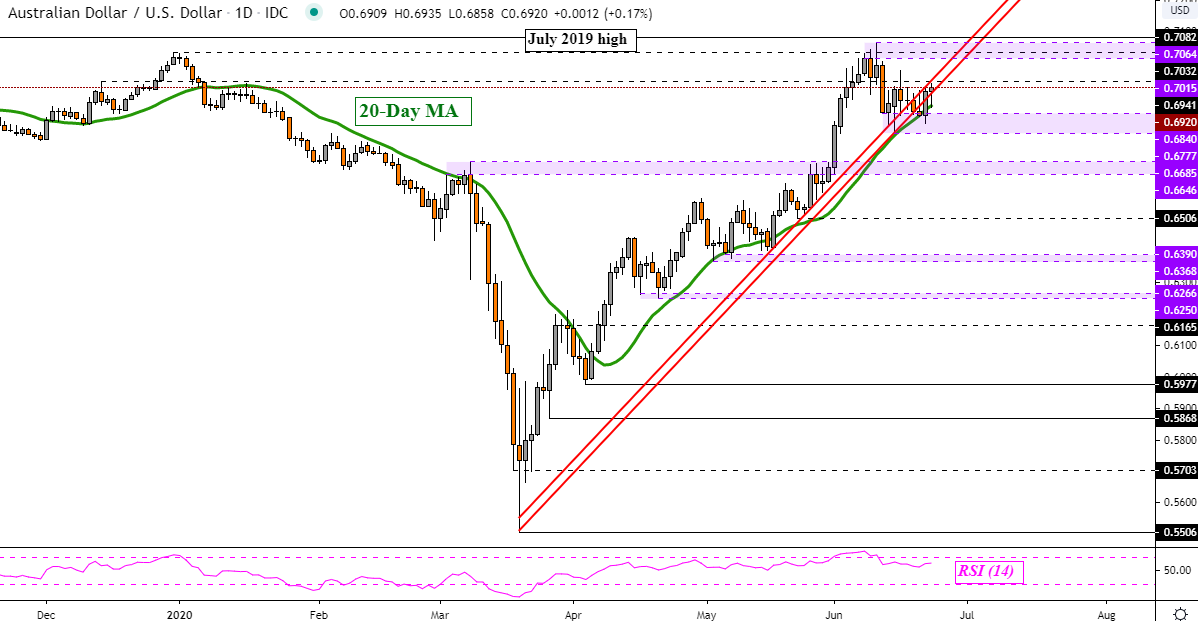
The Australian Dollar continues to trade sideways as AUD/USD pressures key rising support from March’s bottom. The 20-day moving average is holding up here as well and a push above 0.7032 exposes the 0.7064 – 0.7082 resistance range. Key support sits below at 0.6777 – 0.6840. A drop through the latter may open the door to a broader reversal.
| Change in | Longs | Shorts | OI |
| Daily | -18% | 6% | -7% |
| Weekly | -21% | 26% | -3% |
AUD/USD Daily Chart
--- Written by Daniel Dubrovsky, Currency Analyst for DailyFX.com
To contact Daniel, use the comments section below or @ddubrovskyFX on Twitter


