


Japanese Yen Technical Analysis Talking Points:
- USD/JPY is inching higher once again
- However impetus is lacking and a renewed downside test may be on the cards
- GBP/JPY may be topping out also
Get live and interactive coverage of all major Japanese economic data at the DailyFX Webinars. We’d love to have you join us.
The Japanese Yen remains mired against the US Dollar on its daily technical chart, but USD/JPY bulls have yet to challenge seriously the top of that pair’s established trading range. That top comes in at 111.83, a point which has drained bullish enthusiasm on a daily closing basis since July 20.

Clearly, that is going to have to change if the pair is to progress, with the previous significant peak in sight if it does. That was July 18’s 113.21, a level matching this year’s top. That was made in January as a hangover from the climb seen up the peaks of December 2017.
So much for upside targets. However, there are perhaps reasons to suspect that a test lower is more likely. The 20-day moving average recently crossed below the 50-day, a switch which can often herald a down-move. That said momentum indicators do not back up this prospect unequivocally by any means. Indeed, the USD/JPY Relative Strength Index suggesting neither significant overselling or buying now.
Still, the pair is holding firm around 111.15. That level is is notable as the first, 23.6% Fibonacci retracement of the rise up from the lows of late March to that July peak.
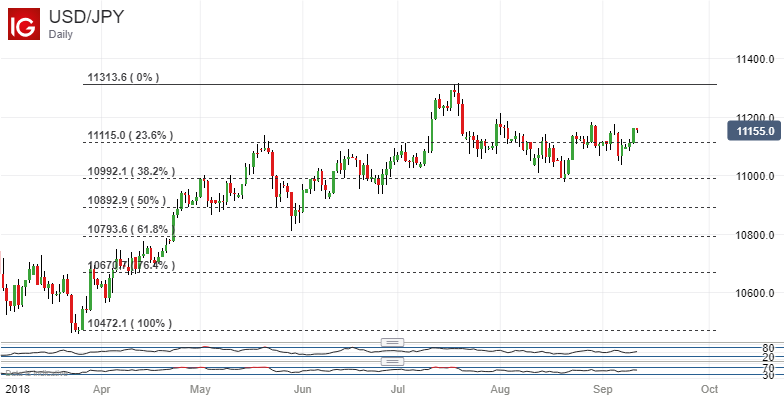
It has risen quite sharply above that support point this week but it is obvious from that chart that these retracements matter strongly in current USD/JPY daily-chart moves. A slip below 111.15, ill bring the 38.2% point into focus, and that isexactly where the pair bounced back in late July.
Meanwhile GBP/JPY has also made some progress to the upside with the UK Pound supported against the Japanese Yen and much else on a fundamental basis by hopes that a Brexit deal may be in sight. Still, with British parliamentarians deadlocked about any settlement, there is still a long way to go and gains on this score would seem very fragile.

Technically speaking the rise they have produced appears to be topping out short of the cross’s previous peak. That was late August’s 145.63. If this cannot be convincingly topped then a retest of recent lows in the mid-143.20s looks likely with August 15’s low of 1139.88 lurking below them.
Resources for Traders
Whether you’re new to trading or an old hand DailyFX has plenty of resources to help you. There’s our trading sentiment indicator which shows you live how IG clients are positioned right now. We also hold educational and analytical webinars and offer trading guides, with one specifically aimed at those new to foreign exchange markets. There’s also a Bitcoin guide. Be sure to make the most of them all. They were written by our seasoned trading experts and they’re all free.
--- Written by David Cottle, DailyFX Research
Follow David on Twitter @DavidCottleFX or use the Comments section below to get in touch!


