


GOLD & CRUDE OIL TALKING POINTS:
- Gold prices may extend gains as Sino-US trade war sours sentiment
- Uneven US Dollar gains may be insufficient offset to bond yield drop
- Crude oil prices may overlook API data with OPEC+ meeting eyed
Gold prices marked time yesterday, digesting losses after Friday’s dramatic selloff. A tepid downshift in Treasury bond yields offered a bit of support as trade war jitters undermined risk appetite but a resilient US Dollar offered a counterweight, capping the capacity for anti-fiat gains.
Crude oil prices mounted a spirited recovery after Friday’s dramatic plunge as markets position for this week’s much-anticipated OPEC+ meeting. The gathering of cartel officials and their counterparts from like-minded producer nations will weigh a Russia- and Saudi-backed proposal to ease coordinated output curbs.
Moscow and Riyadh – until recently the leading voices directing the scheme as an effort to drain brimming global inventories and boost prices – now want to scale it back to offset supply disruptions from Venezuela and Iran. This is opposed by other producers however, setting the stage for a contentious sit-down.
Against this backdrop, prices rose amid reports that preliminary talks envision an output boost of 300-600k barrels per day that lasts for the next several months. That is a far more modest proposal than the 1.5 million barrel increase favored by Russia.
GOLD MAY RISE ON TRADE WAR WORRIES, API DATA DUE
From here, swelling risk aversion might help gold mount a more significant recovery. Signs of escalation in the Sino-US trade war have weighed heavily on sentiment in Asia Pacific trade. S&P 500 futures are now nearly a full percentage point lower before Wall Street returns online. That seems likely to send capital fleeing to the haven of Treasury bonds and pressure yields lower, helping non-interest-bearing alternatives.
The US Dollar is another likely beneficiary of anti-risk capital flows, but not ubiquitously so. The currency may rise against most of its top counterparts but carry trade liquidation will probably see it outpaced by the Japanese Yen. If this keeps it somewhat anchored on average, the lead from falling rates may prove to be a more potent driver for the yellow metal.
As for crude oil, the weekly set of API inventory flow statistics headline the docket Tuesday. The outcome will be judged against expectations of a 2.57 million barrel drawdown economists expect to see in official EIA figures due the following day.Still, headline flow shaping OPEC+ expectations might remain at the forefront and overshadow other would-be catalysts.
Learn what other traders’ gold buy/sell decisions say about the price trend
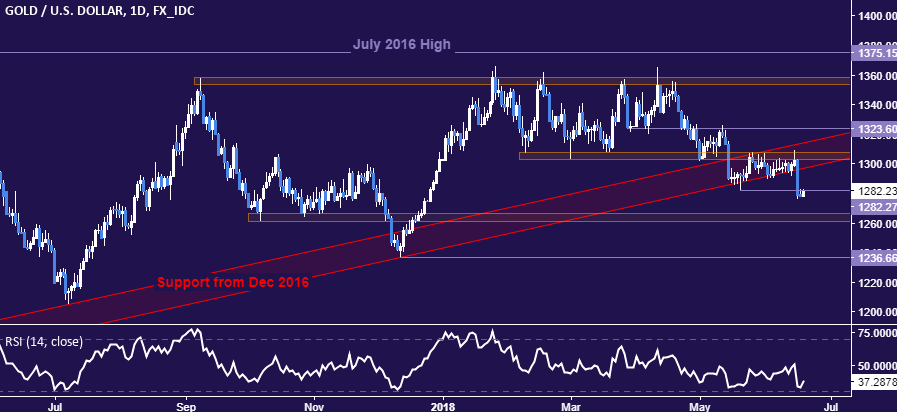
GOLD TECHNICAL ANALYSIS
Gold prices are digesting losses after finally breaking support guiding the uptrend from December 2016. A resumption of the down move that breaches below the 1260.80-66.44 area exposes the December 2017 low at 1236.66. Alternatively, a move back above the May 21 low at 1282.27 opens the door for a retest of former support in the 1302.97-1307.32 area.
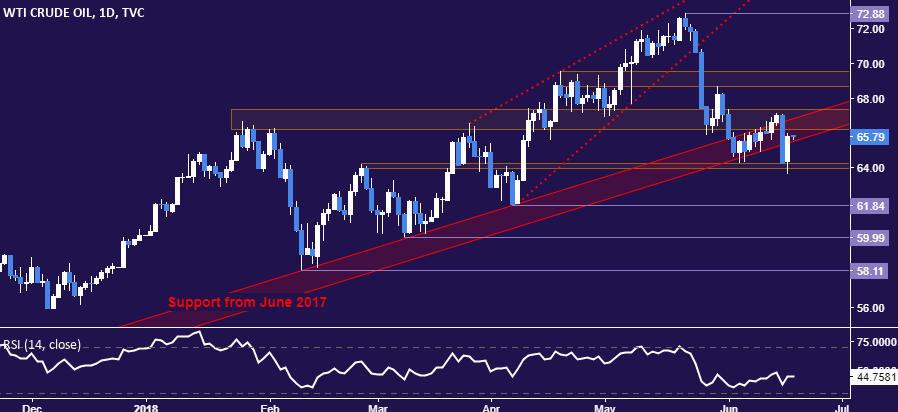
CRUDE OIL TECHNICAL ANALYSIS
Crude oil prices corrected higher to retest former support as resistance after breaking though the bounds of the uptrend from June 2017. A daily close back above the 66.22-67.36 area is needed to overturn the near-term bearish bias, exposing the 68.64-69.53 region next. Alternatively, push below support in the 63.96-64.26 zone targets the April 6 low at 61.84 next.
COMMODITY TRADING RESOURCES
- See our guide to learn about the long-term forces driving crude oil prices
- Having trouble with your strategy? Here’s the #1 mistake that traders make
- Join a Trading Q&A webinar to answer your commodity market questions
--- Written by Ilya Spivak, Currency Strategist for DailyFX.com
To contact Ilya, use the comments section below or @IlyaSpivak on Twitter


