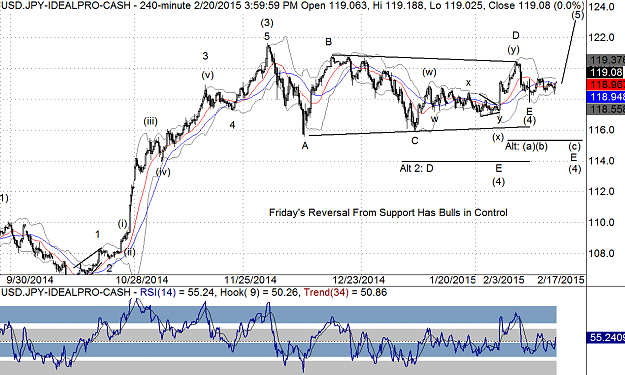
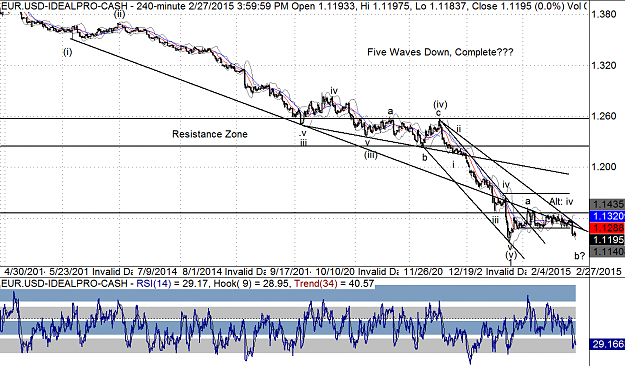
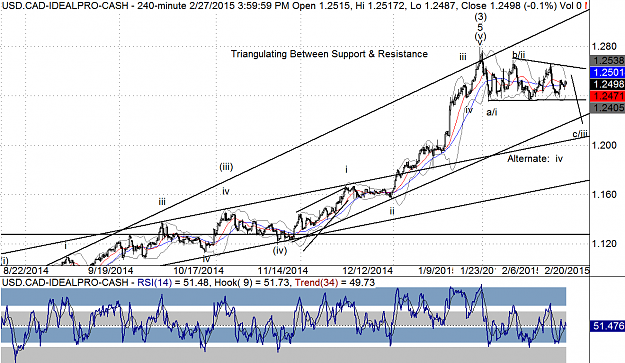
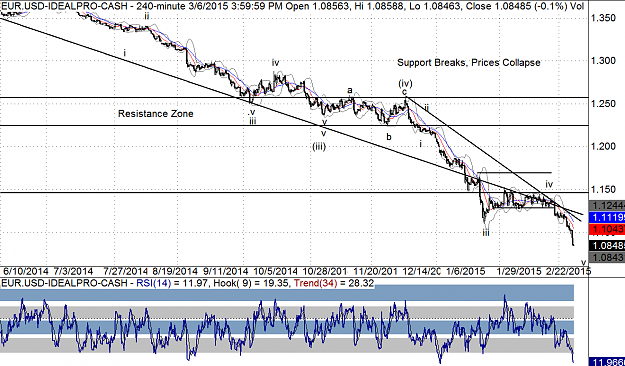
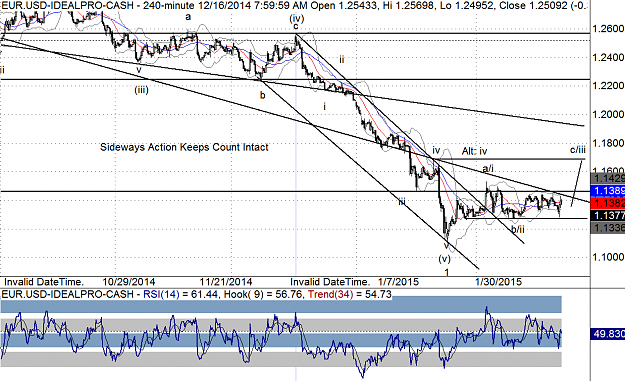
We have a clear five waves down from the wave (iv) high. So, even if our larger count is off base, we could still see an upward correction of that impulse reach 1.18 or so. We cant rule out that the larger trend is still down per the alternate count, or even something more bearish, but the action down from the a/i high looks corrective. As long as prices are above 1.1265 we can expect prices to head higher near term. Even a break of that level might only mean a flat correction for wave 2 was underway. Theres plenty of resistance overhead, but were going to stick with our count, unless evidence suggests otherwise. Lastly, notice the behavior of RSI, where it pushed into the upper blue zone (sustainable bullish territory) at the wave a/i high, held above the lower grey area for the past two weeks, and has pushed back above 50 on Friday. All of that supports further upside, albeit as nimble bulls. So, both Context and Momentum are bullish now we look for Signals.
Read more on the TraderSkillset website | A Sideways Week Means Dollar Pullback Can Continue | http://traderskillset.com/sideways-means-pullback/
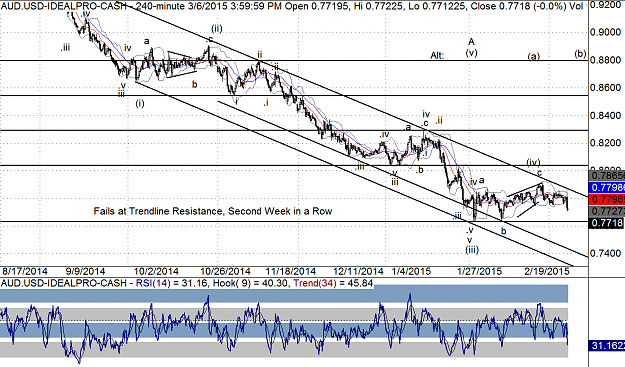
Attached Image (click to enlarge)
Read more on the TraderSkillset website | A Sideways Week Means Dollar Pullback Can Continue | http://traderskillset.com/sideways-means-pullback/