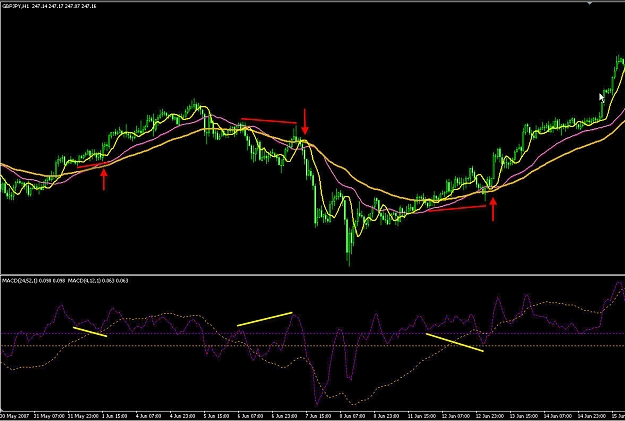
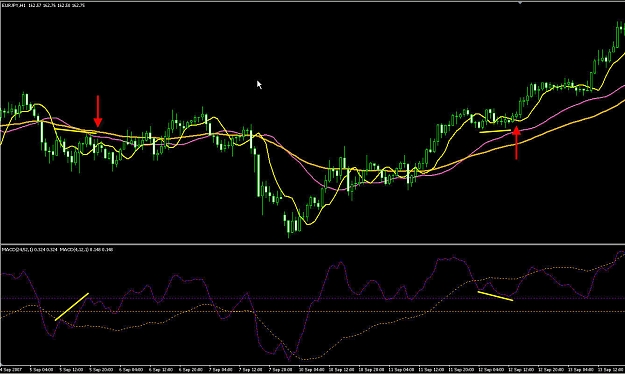
Thanks to everyone who's inspired, shared knowledge. Here's a method that works pretty well. I prefer 1 hr, but the pattern shows up on every time frame. The chart shows two buys and a sell. The longer term MACD has crossed zero, the shorter term pulls back with price creating a reverse divergence. When price turns back toward primary trend (in agreement with longer term MACD) and crosses yellow MA, you're in. Exit however you prefer to exit. I also use the shorter term MACD to find regular divergence.
When markets get choppy, go to a shorter time frame. If you're already there, go do something else for a while...
When markets get choppy, go to a shorter time frame. If you're already there, go do something else for a while...
Attached Image (click to enlarge)