What are you trying to do advertise your website?
Firstly You dont say anything just show a chart and link to a non english site.
Please refrain from such stuff.
Moneydeep
Thank you for helping me make some sense of Gann.The video really helped.
Question:How many lines do you draw from the low column and from the high column?
Ignored
I draw them to the high from the bottom and to the low from the top. That way I get inter day levels.
I've been wandering around this forum for a while and been trading for around a year now. Still learning lots of stuff. I like to help others so posting this.
I call this the Gann Price vibration system. It is not a system by itself but is more a confirmation system. Add this to whatever method you trade and it will help you for sure.
It's based on the gann wheel. From a low you can predict possible points where the market will vibrate to. Same with a high. Price will either bounce off, gap through, or blow through these...
Ignored
Amazing thing your excel file.....
I wonder if you could give some more detailed explanations about how you builded up the tabs.
And why there are 4 columns?
thanks in advance...still amazed...
Hi all.
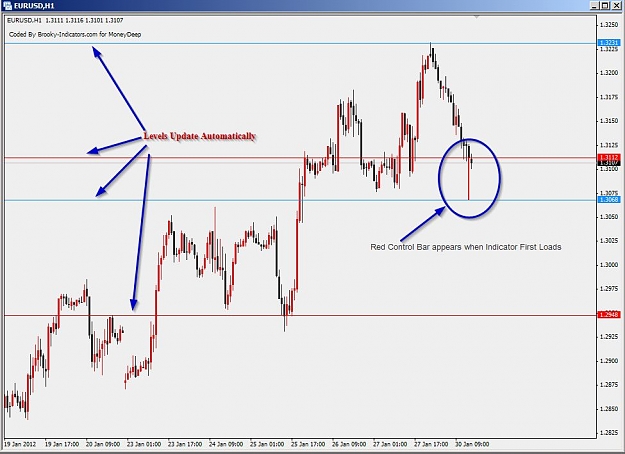
I was intrigued by the calculations that MoneyDeep was using so I knocked up an indicator that would automatically show the first circle lines which seem to be the most used. I have checked it against MoneyDeeps calcs and it appears to be correct. If not the code is exposed and changeable. It is all longhand code because I wrote it as I saw it so if someone wants to loop it, be my guest.
Charts below explain how it works, but essentially, when you load the indicator you will see a red vertical control bar under the last candle and some horizontal lines.
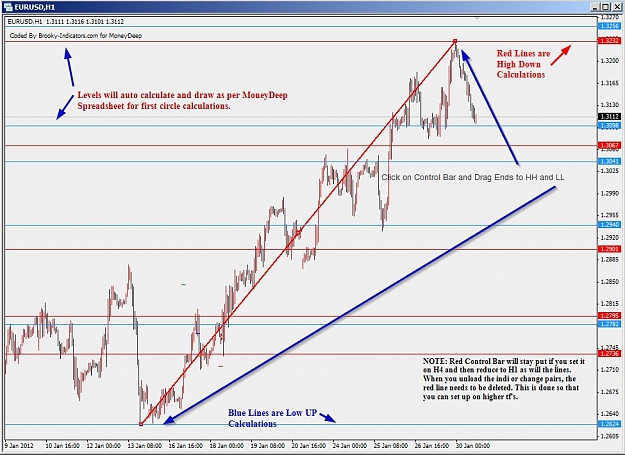
Just select the start or end of that red line and place it on whatever High or Low you want. The horizontal lines will adjust per MoneyDeeps calculations. ( Assuming I read the spreadsheet correctly :-)
You can open a bigger timeframe and use Highs and Lows from it if you want and then back down to a smaller tf without the lines moving. I need to not lose the Red line when you change tf's and the payback for that is that you have to delete this line when unloading the indicator. All other lines etc will unload.
Hi all.
I was intrigued by the calculations that MoneyDeep was using so I knocked up an indicator that would automatically show the first circle lines which seem to be the most used. I have checked it against MoneyDeeps calcs and it appears to be correct. If not the code is exposed and changeable. It is all longhand code because I wrote it as I saw it so if someone wants to loop it, be my guest.
Charts below explain how it works, but essentially, when you load the indicator you will see a red vertical control bar under the last candle and some...
Ignored
Thanks a lot for this. I know this thread is dead and gone since I guess no was really interested. I tested the indi and it seems to be looking good for now
Thanks a lot for this. I know this thread is dead and gone since I guess no was really interested. I tested the indi and it seems to be looking good for now
Ignored
It's great nobody really knows how to use Gann's techniques or else the markets would be destroyed.
I was asked to make the indicator into an Auto version so that one could quickly apply it to many charts consistently at say the high and low of 2 or 3 days ago.
Attached is the indicator with this option able to be set. You can still use it manually if you turn UseAutoTfHiLos off, but it is on by default.
Inputs are as below.
extern bool UseAutoTfHiLos = true;
extern int AutoTf2Use = 1440;
extern int MtfBarBack = 1;
AutoTf2Use obviously needs to bigger than the tf the chart is on and the MtfBarBack option tells the indi which MTF Bar (Day or H4 etc) it should take the levels from.
I was asked to make the indicator into an Auto version so that one could quickly apply it to many charts consistently at say the high and low of 2 or 3 days ago.
Attached is the indicator with this option able to be set. You can still use it manually if you turn UseAutoTfHiLos off, but it is on by default.
Inputs are as below.
extern bool UseAutoTfHiLos = true;
extern int AutoTf2Use = 1440;
extern int MtfBarBack = 1;
AutoTf2Use obviously needs to bigger than the tf the chart is on and the MtfBarBack option tells the indi...
While I don't trade this concept, I am a big believer in Fib confluence and all that.
It occurred to me that if you have several copies of the indi on chart with either different MTF bars back or different periods that you would have the benefit of confluence on one chart.
The updated indicator allows you to do this by simply putting a different letter in the option
extern string IndiCopyOnChart = "a";
Example chart uses 4 copies of the indi called a.b.c and d. They are set at H4, Daily, Weekly and Monthly and all displayed on an M15 chart.
For those that understand these levels, I imagine that this is beneficial.
Cheers
Brooky.
While I don't trade this concept, I am a big believer in Fib confluence and all that.
It occurred to me that if you have several copies of the indi on chart with either different MTF bars back or different periods that you would have the benefit of confluence on one chart.
The updated indicator allows you to do this by simply putting a different letter in the option
extern string IndiCopyOnChart = "a";
Example chart uses 4 copies of the indi called a.b.c and d. They are set at H4, Daily, Weekly and Monthly and all displayed on an...
I have had a chance to tidy up the code and work on the color options. This version should be the last unless some bugs crawl out.
You can now properly change colors and styles for different timeframes.
Tpl attached of a Multi Timeframe setup with H4, Daily, Weekly and Monthly all on the same chart.
Mousing over a line will let you know what Timeframe it belongs to.
Lines will readjust as each Timeframe plots a new bar.
eg: H4 will readjust once every 4 hours etc.
Confluence is instantly visible. It would be nice to see someone come up with the trade strategy now. Thanks to MoneyDeep for the idea. @ MoneyDeep. You may want to put this version on your front post to stop the inevitable newbie, what version should I use questions.
Cheers
Brooky
I have had a chance to tidy up the code and work on the color options. This version should be the last unless some bugs crawl out.
You can now properly change colors and styles for different timeframes.
Tpl attached of a Multi Timeframe setup with H4, Daily, Weekly and Monthly all on the same chart.
Mousing over a line will let you know what Timeframe it belongs to.
Lines will readjust as each Timeframe plots a new bar.
eg: H4 will readjust once every 4 hours etc.
Confluence is instantly visible. It would be nice to see someone come up...
Ignored
I have a Gann Wheel and had used it quite a lot for futures years ago. Still sits here at my desk. HOWEVER, this software is amazing!! To be able to do the multiple calculations like your indicator does saves valuable time indeed. Well done!!
Although I originally was using this on swings and looking for confluence. This idea of interday highs and lows seems and interesting path to tread on.
I really appreciate all the effort people are putting into this.
Although I originally was using this on swings and looking for confluence. This idea of interday highs and lows seems and interesting path to tread on.
I really appreciate all the effort people are putting into this.
Ignored
Well Moneydeep; as you know, we have half of the puzzle done here. We have charted price levels, now the most interesting addition is TIME confluence. When time & price are in confluence, expect a big bang.
So, off each high and low, count 45 bars, 90 bars, 180 bars and 360 bars into the future to plot the time cycles. Then watch the fireworks when the major time markers line up with the major price levels...it's uncanny how deadly accurate they can be.
Can an time indicator be created to acomplish this?
Ignored
Hi
Excellent suggestion. I can have a look at picking possibly HH and LL each day of the past x days and automate a series of fib timelines that would do this.
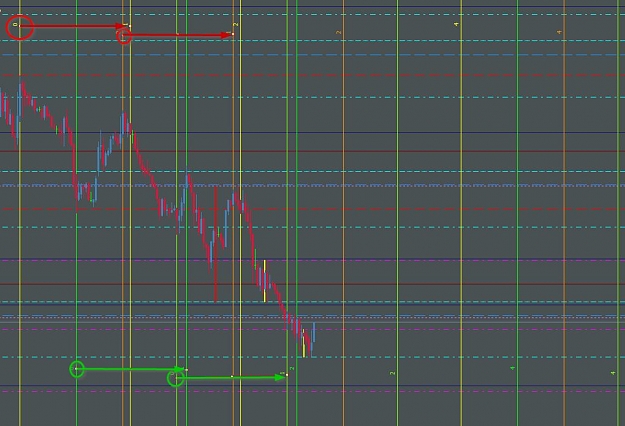
For the moment because it is probably more accurate visually, you could use the Fib Timelines tool in MT4 set to 0,1,2,4,8 and pull the 0 to 1 line over 45 bars and as you say, watch the magic.
I have 2 sets on highs in yellow to indicate they are on highs and 2 on green which are on lows.
Pic attached with a circle of where the timeline was started and an arrow to where it was pulled to (45 bars). Indeed the magic appears. Point to note is that both the point 2 longs( current) and shorts (previous) where projected 4 days ago. I think they call that a leading indicator :-)
I will have a look at the day high low idea when I get a moment.
Cheers
Brooky.
Hi
Excellent suggestion. I can have a look at picking possibly HH and LL each day of the past x days and automate a series of fib timelines that would do this.
For the moment because it is probably more accurate visually, you could use the Fib Timelines tool in MT4 set to 0,1,2,4,8 and pull the 0 to 1 line over 45 bars and as you say, watch the magic.
I have 2 sets on highs in yellow to indicate they are on highs and 2 on green which are on lows.
Pic attached with a circle of where the timeline was started and an arrow to where it was pulled...
Ignored
I think you are on the right track...however there may be too many lines on the chart to pick from. So I think that the swing highs/lows that your original indicator gets is probably correct... That is how the original Gann Wheel is calculated...Take the recent high and plot 45^ from there to get the price. Then when you count the bars forward from that recent high you arrive at the future bar then plot that.
Then you would do the same exercise for the recent swing low.
Ignored
Hi
The indicator has not changed. It is only a tpl with several instances of the indi to highlight what can be done with it. If you can post a pic of your preferred scenario it would be helpful.
Cheers
Brooky