A Basic guide on how to read and trade the markets
We want to categorize the markets and its current state and therefore draw a Map , so to speak highlighting the important key levels in order to help us in judging the current market situation and its context based on the buying and selling pressure , aswell as if the market is balanced , imbalanced or about to change in one of the two states. In order to know where we are and how to trade whatever is in front of us at the moment.
For this we only need to know the context, location and price action to make an informed decision in all market situations without getting lost , we do this with the
following guide
We do the following in all relevant timeframes , starting with the biggest and work our way down to the lowest.
You can use the following techniques on ALL timeframes , however you should be aware that usually the bigger timeframes dominate the smaller ones , as long
term traders dominate small term traders , due to their size , and risk tolerance (wider stops etc.) so if you trade a long breakout on a 1min chart wich trades at a
daily or weekly resistance level , you have some big odds stacked against you . aswell as you shouldnt overdo with drawing in all timeframes from hourly to 30min to 15
min to 5 min etc.. or you will get into analysis paralysis and really all relevant
information is allready there. for our basics we use the Weekly , Daily and Hourly timeframes thats it , anything else can be added later on individual TFs if needed, due
to entering or managing a position ,more on that later..
Start with the Weekly then Daily and last on the Hourly with the following process
First we draw in the levels of support and resistance
One can expect to find support where the most substantial buying has occurred in the past and resistance where the most substantial selling has occurred. to halt price
for further advance and even reverse. However price may also reverse at extremes due to the fact that there is no interest in following price any higher or lower ,ie less
activity, resistance in this case refers to resistance of a continuation of the move.
Second we spot ranges and consolidations which may visualized due to the all ready drawn in support and resistance levels.we also draw in the mean of the ranges.
Traders seek value; value is price over time; price is arrived at by negotiation between buyers and sellers. if value is found price is in a balanced state and is moving
sideways limited between support and resistance , the middle of the range where most of the trading activity is located is considered fair price or mean.
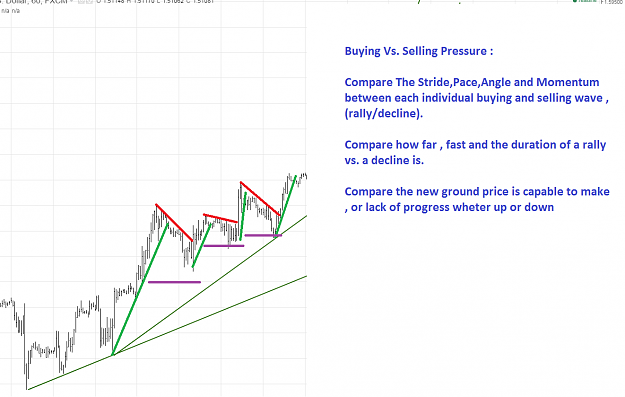
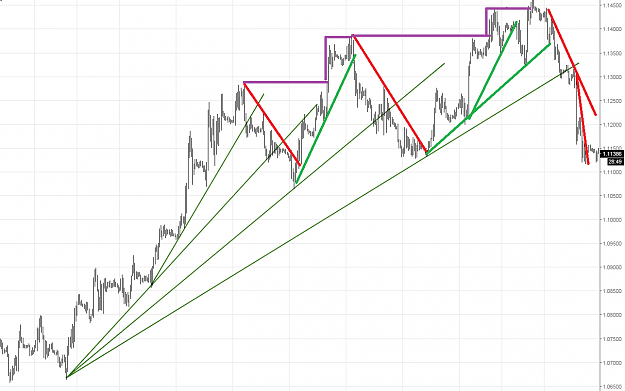
Third we draw in trendlines and trend channels aswell as the mean of the channels and the 50% retracements of any relevant trend (intermediate)
Trendlines are simple tools to judge the markets trend direction buying and selling pressure , pace,momentum and stride to gain an idea on the current imbalance and
how strong it is and when its likely about to come to an end.
A Trendchannel is nothing more then a diagonal trading range where price is contained in well defined limits of upper and lower channel lines reffered as overbought and
oversold line with a rising or falling mean 50% retracements are a good to measure the strenght or weakness of a move as it usually indicates capitulation if its
broken or strenght/weakness if it holds.
if have drawn in all relevant levels we can start our analysis like so
1st we analyse the context of the market ie. the bigger picture
Waht ?
are we in a trend ? up? down ? is it contained within a channel ? are we moving in a range ? at support ? at resistance ? signs of weakness? signs of strenght ?
Context:
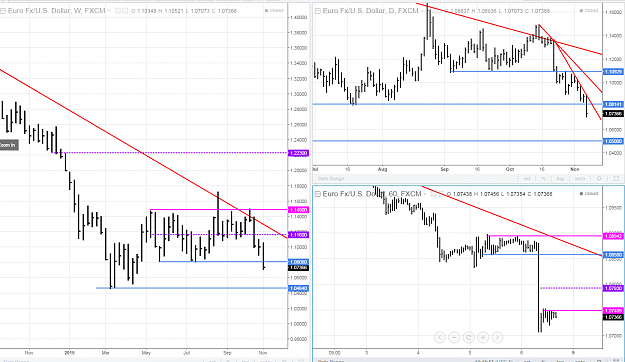
we are still in a downtrend on eur/usd ,the decline came to an halt as price attempted a rally from the lows of 1.0464 , which tunred into range with
resistance beeing 1.1490 and support at 1.0808 whch leaves us with a mean at 1.1160 , we had a breakout attempt which quickly reversed back into the range ,
respecting the trendline any furthe atempt of a break resulted in a lower high and a respect of the resistance , price now is on decline on increased selling pressure
breaking the support at 1.0808 and heading towards the lows of 1.04640
2nd we want to know where we are in the bigger picture
Where?
at support ? at resistance? at a mean? at a 50% retracement? overbought? oversold? signs of strenght ? signs of weakness ?
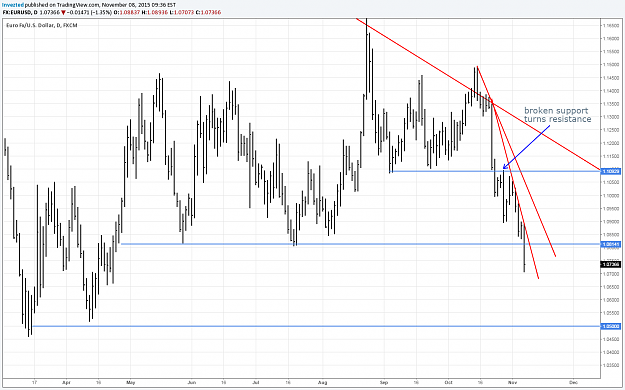
after we broke the minor support at 1.10930 , price tested that level and it turned into resistance the decline happens on increased momentum and broke the support
level of 1.08140
signs of weakness:
broken support 1.10929 turns resistance
increased momentum to the downside
location:
broken support 1.08140
3rd what setups and trading ideas do we lookout for, based on 1-2 and ABC
How?
signs of strenght ? signs of weakness?, buying pressure ? , selling pressure ? what is price capable to do and what not and at which key level ? what if price does this or
that ? higher low ? lower high ? , balanced ?, imbalanced ? indecision? is momentum picking up or slowing down ?, where are potential stop levels ? how does the
market react at certain levels? how does this all fit into the context ? what setups are worth to consider ? where are potential trouble areas ahead? what about the
risk ?
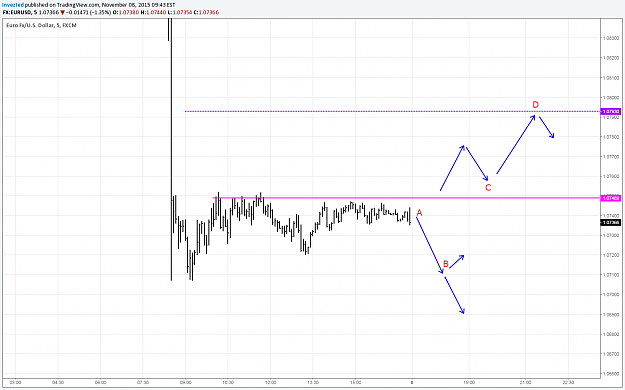
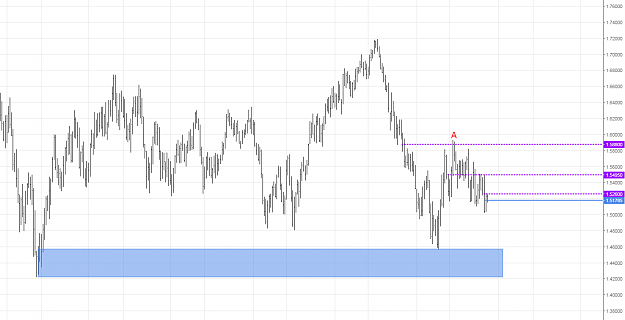
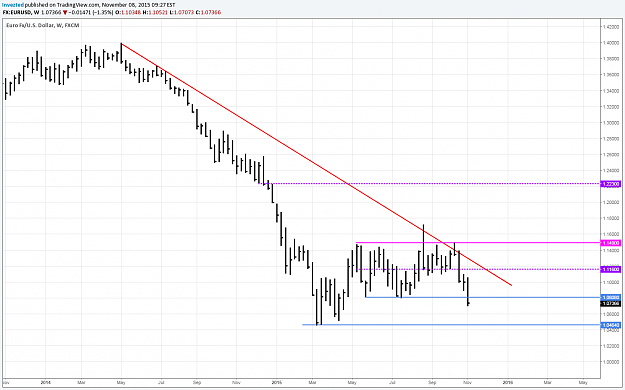
we are currently movinge sideways , with a well defined resistance level at 1.0750 any break of the current lows and we will retest the cuurent lows at 1.0710 representing a short opportunity (A)
should a retest of the lows tunr out to be sucesfull one could watch out for a reversal for a long play (B) to test resistance again if price breaks that low aswell one
should excpect further downside potential to the lows of 1.0500
a breakout to the upside and a pullback wich turns resistance into support could be played to test the 50% retracement of the selloff (C)
a potential reversal could be played at the rejection of the 50% retracement at 1.07930 of the selloff (D)
shorts are in the favour of the bigger picture and the current location , which is in the middle of nowhere , so one could wait til price hits
the extremes at 1.0500 or 1.07930
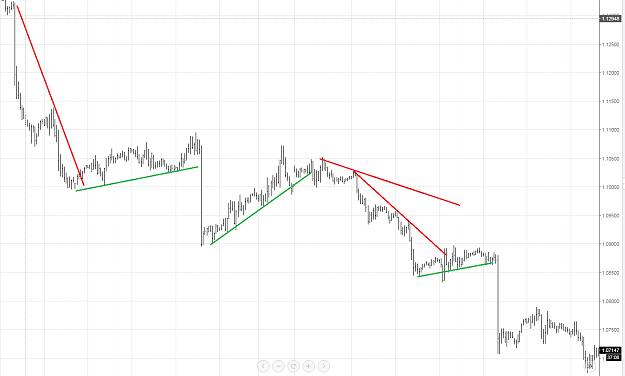
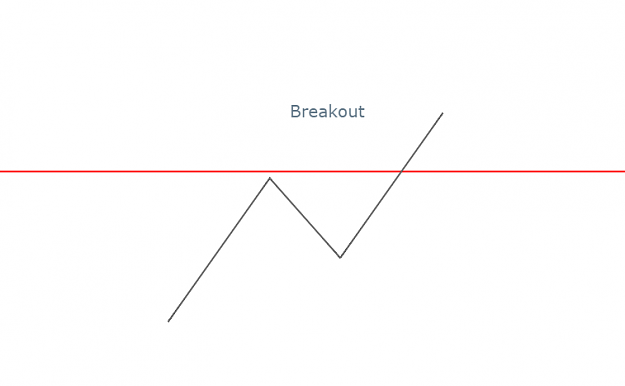
Price is capable of only three things, either a breakout, a retracement or a reversal
If, for example, price bounces off or launches itself off the bottom of the range (support), trade the reversal and go long. If instead it falls through support, short the
breakout (or breakdown, if you prefer). If you dont catch the breakout, or you prefer to wait in order to determine whether or not the breakout was real, prepare
yourself to short whatever retracement there may be to what had been support and may now be resistance.
A) Breakouts
breakouts occure out of ranges and or support and resistance levels , breakouts can be played aggressively or more safer if ones waits for a retracement after a breakout
, as often breakouts are faded by institutions and to catch most on the wrong side , ie fakeouts, and shakeouts, one can also lookout on any signs of absorbtion or
consumption to position oneself well ahead of the breakout , this requires some skill to read price , but riskwise its on the safer side compared to an aggressive entry.
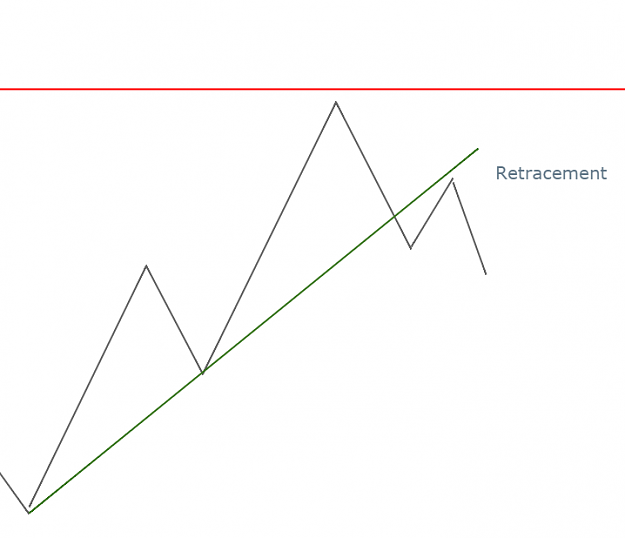
B) Retracement
The first pullback after a break through support or resistance or a V reversal , a retracement can either be seen after a breakout or in any form of absorbtion and
consumption aswell as at the mean of the ranges and in trends preferably into former support and resistance levels and 50% levels , these are continuation moves.

C) Reversal
A bounce of or rejection of the upper or lower limit of a trading range. aswell as of overbought , oversold levels of trading channels , any reversal may add to weakness
or strenght , its also the result of a buying or selling climax
We want to categorize the markets and its current state and therefore draw a Map , so to speak highlighting the important key levels in order to help us in judging the current market situation and its context based on the buying and selling pressure , aswell as if the market is balanced , imbalanced or about to change in one of the two states. In order to know where we are and how to trade whatever is in front of us at the moment.
For this we only need to know the context, location and price action to make an informed decision in all market situations without getting lost , we do this with the
following guide
We do the following in all relevant timeframes , starting with the biggest and work our way down to the lowest.
You can use the following techniques on ALL timeframes , however you should be aware that usually the bigger timeframes dominate the smaller ones , as long
term traders dominate small term traders , due to their size , and risk tolerance (wider stops etc.) so if you trade a long breakout on a 1min chart wich trades at a
daily or weekly resistance level , you have some big odds stacked against you . aswell as you shouldnt overdo with drawing in all timeframes from hourly to 30min to 15
min to 5 min etc.. or you will get into analysis paralysis and really all relevant
information is allready there. for our basics we use the Weekly , Daily and Hourly timeframes thats it , anything else can be added later on individual TFs if needed, due
to entering or managing a position ,more on that later..
Start with the Weekly then Daily and last on the Hourly with the following process
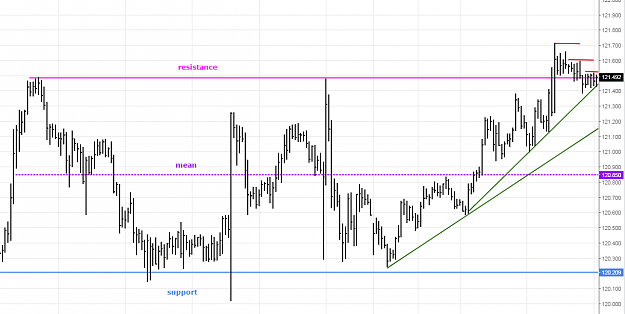
First we draw in the levels of support and resistance
One can expect to find support where the most substantial buying has occurred in the past and resistance where the most substantial selling has occurred. to halt price
for further advance and even reverse. However price may also reverse at extremes due to the fact that there is no interest in following price any higher or lower ,ie less
activity, resistance in this case refers to resistance of a continuation of the move.
Second we spot ranges and consolidations which may visualized due to the all ready drawn in support and resistance levels.we also draw in the mean of the ranges.
Traders seek value; value is price over time; price is arrived at by negotiation between buyers and sellers. if value is found price is in a balanced state and is moving
sideways limited between support and resistance , the middle of the range where most of the trading activity is located is considered fair price or mean.
Third we draw in trendlines and trend channels aswell as the mean of the channels and the 50% retracements of any relevant trend (intermediate)
Trendlines are simple tools to judge the markets trend direction buying and selling pressure , pace,momentum and stride to gain an idea on the current imbalance and
how strong it is and when its likely about to come to an end.
A Trendchannel is nothing more then a diagonal trading range where price is contained in well defined limits of upper and lower channel lines reffered as overbought and
oversold line with a rising or falling mean 50% retracements are a good to measure the strenght or weakness of a move as it usually indicates capitulation if its
broken or strenght/weakness if it holds.
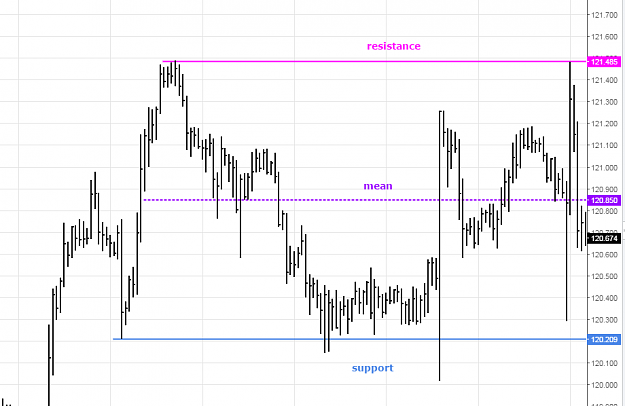
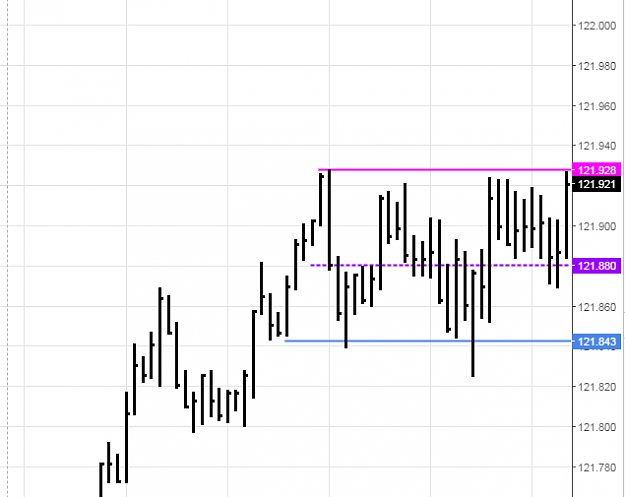
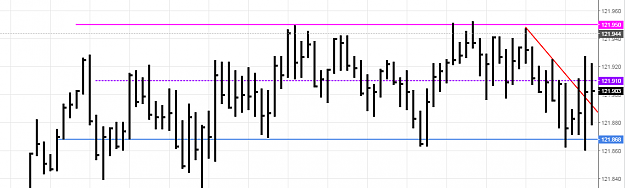
if have drawn in all relevant levels we can start our analysis like so
Attached Image (click to enlarge)
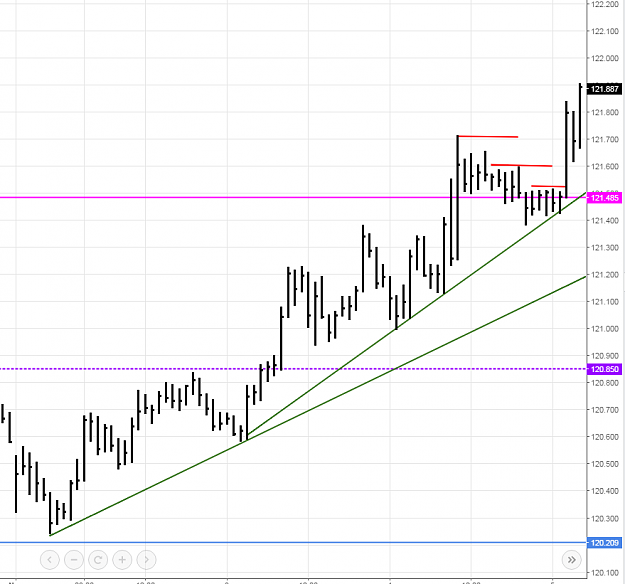
1st we analyse the context of the market ie. the bigger picture
Waht ?
are we in a trend ? up? down ? is it contained within a channel ? are we moving in a range ? at support ? at resistance ? signs of weakness? signs of strenght ?
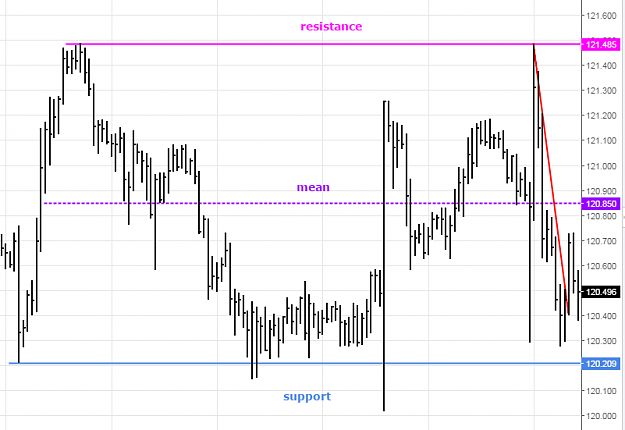
Attached Image (click to enlarge)
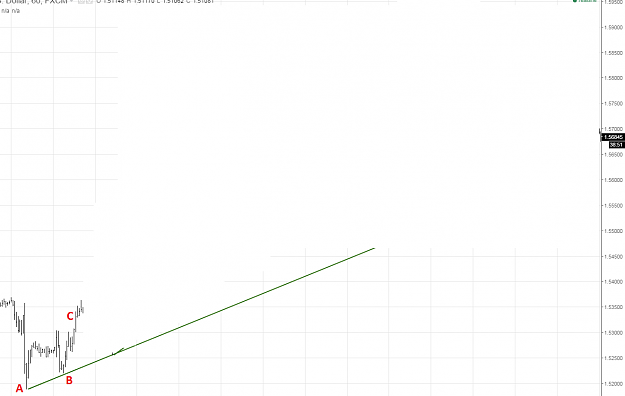
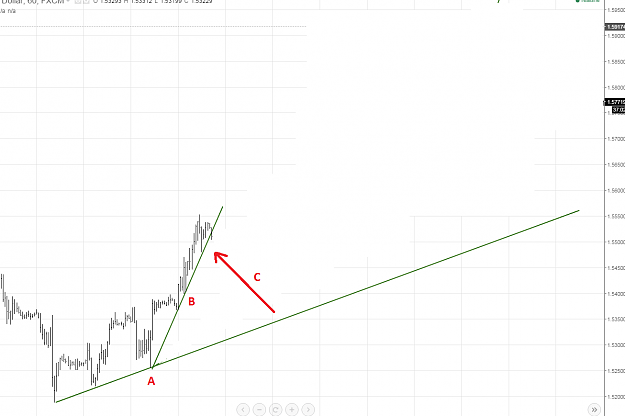
Context:
we are still in a downtrend on eur/usd ,the decline came to an halt as price attempted a rally from the lows of 1.0464 , which tunred into range with
resistance beeing 1.1490 and support at 1.0808 whch leaves us with a mean at 1.1160 , we had a breakout attempt which quickly reversed back into the range ,
respecting the trendline any furthe atempt of a break resulted in a lower high and a respect of the resistance , price now is on decline on increased selling pressure
breaking the support at 1.0808 and heading towards the lows of 1.04640
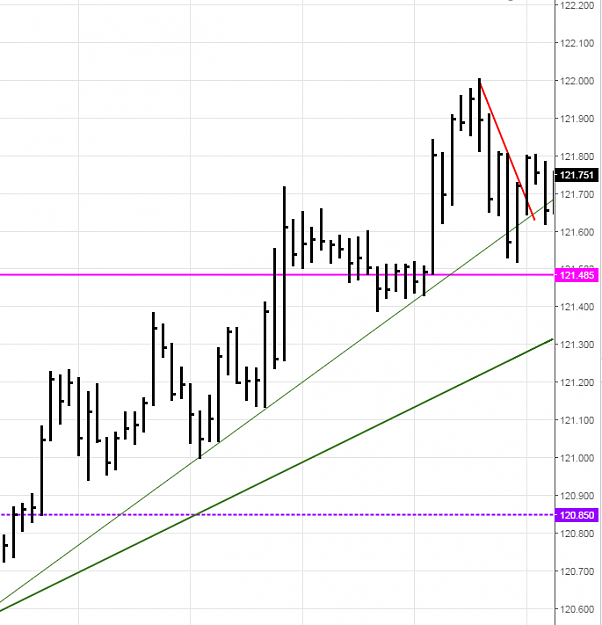
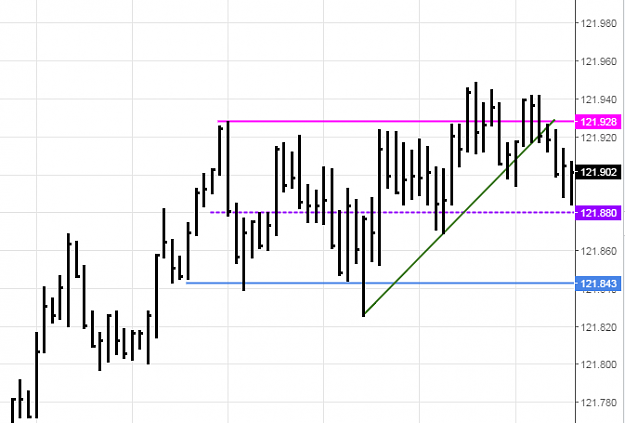
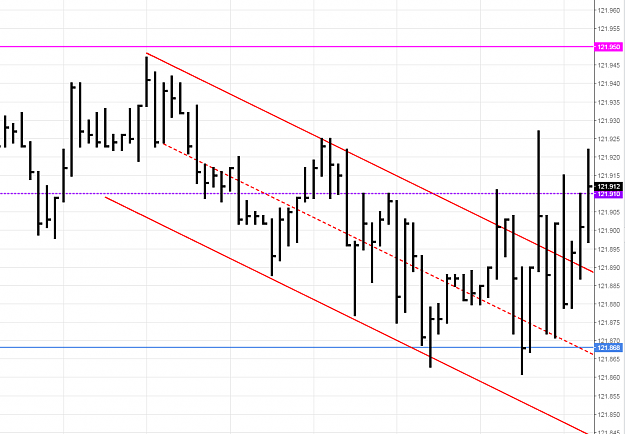
2nd we want to know where we are in the bigger picture
Where?
at support ? at resistance? at a mean? at a 50% retracement? overbought? oversold? signs of strenght ? signs of weakness ?
Attached Image (click to enlarge)
after we broke the minor support at 1.10930 , price tested that level and it turned into resistance the decline happens on increased momentum and broke the support
level of 1.08140
signs of weakness:
broken support 1.10929 turns resistance
increased momentum to the downside
location:
broken support 1.08140
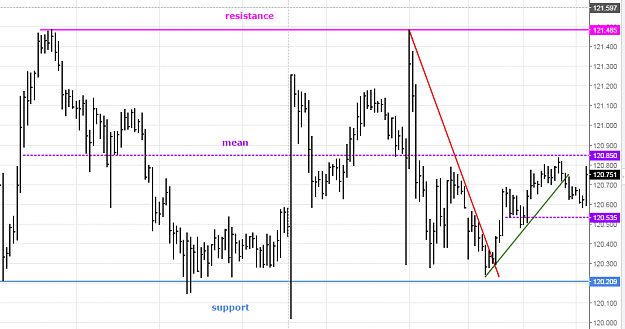
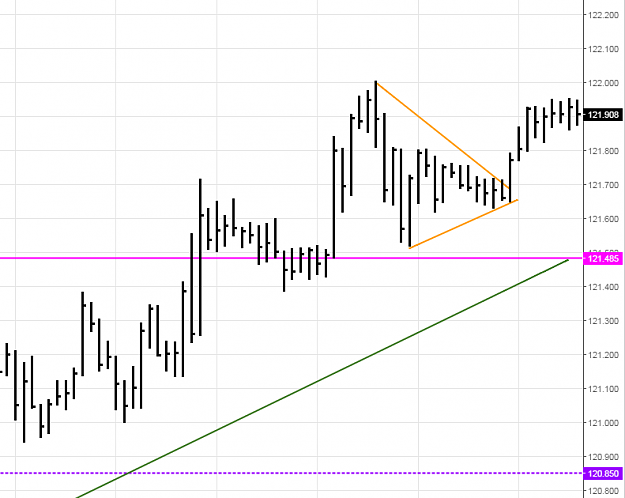
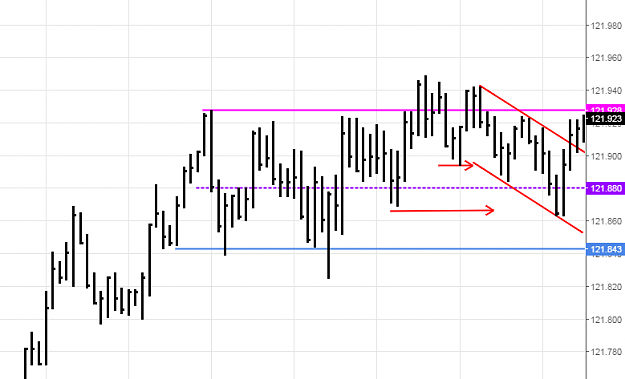
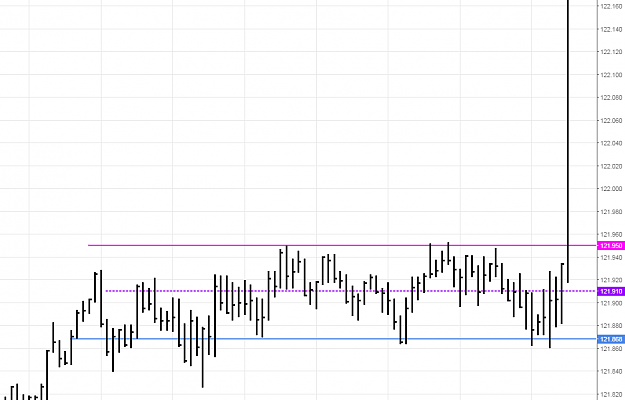
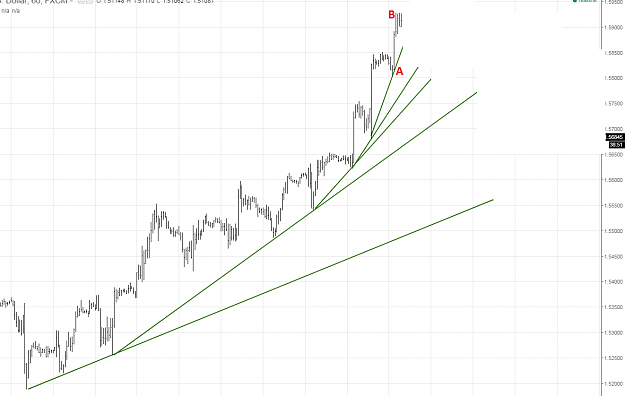
3rd what setups and trading ideas do we lookout for, based on 1-2 and ABC
How?
signs of strenght ? signs of weakness?, buying pressure ? , selling pressure ? what is price capable to do and what not and at which key level ? what if price does this or
that ? higher low ? lower high ? , balanced ?, imbalanced ? indecision? is momentum picking up or slowing down ?, where are potential stop levels ? how does the
market react at certain levels? how does this all fit into the context ? what setups are worth to consider ? where are potential trouble areas ahead? what about the
risk ?
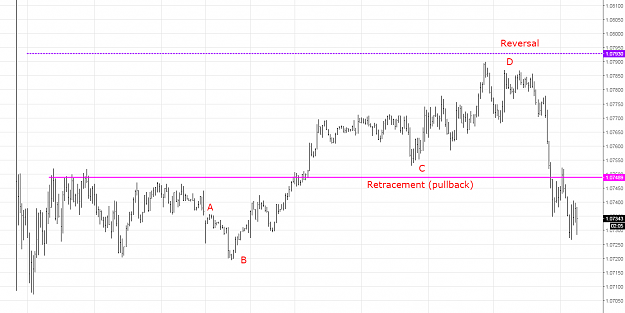
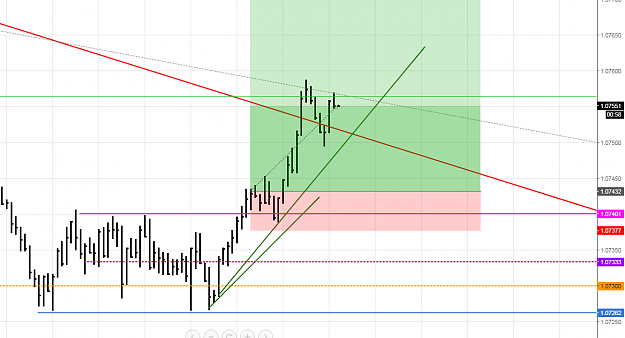
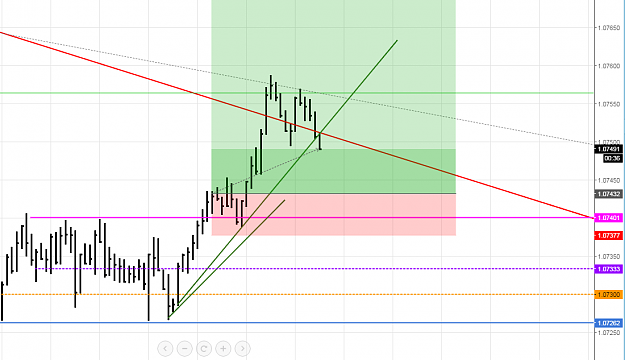
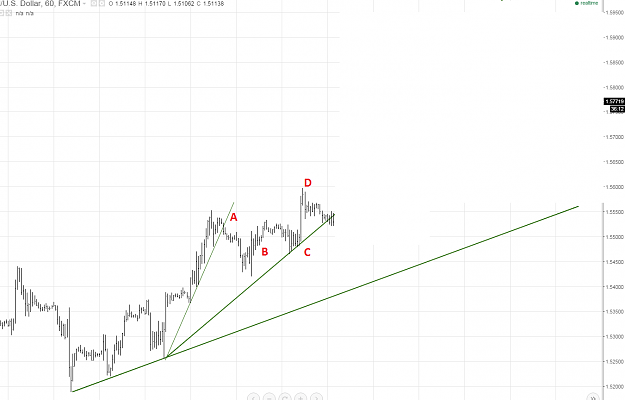
Attached Image (click to enlarge)
we are currently movinge sideways , with a well defined resistance level at 1.0750 any break of the current lows and we will retest the cuurent lows at 1.0710 representing a short opportunity (A)
should a retest of the lows tunr out to be sucesfull one could watch out for a reversal for a long play (B) to test resistance again if price breaks that low aswell one
should excpect further downside potential to the lows of 1.0500
a breakout to the upside and a pullback wich turns resistance into support could be played to test the 50% retracement of the selloff (C)
a potential reversal could be played at the rejection of the 50% retracement at 1.07930 of the selloff (D)
shorts are in the favour of the bigger picture and the current location , which is in the middle of nowhere , so one could wait til price hits
the extremes at 1.0500 or 1.07930
Price is capable of only three things, either a breakout, a retracement or a reversal
If, for example, price bounces off or launches itself off the bottom of the range (support), trade the reversal and go long. If instead it falls through support, short the
breakout (or breakdown, if you prefer). If you dont catch the breakout, or you prefer to wait in order to determine whether or not the breakout was real, prepare
yourself to short whatever retracement there may be to what had been support and may now be resistance.
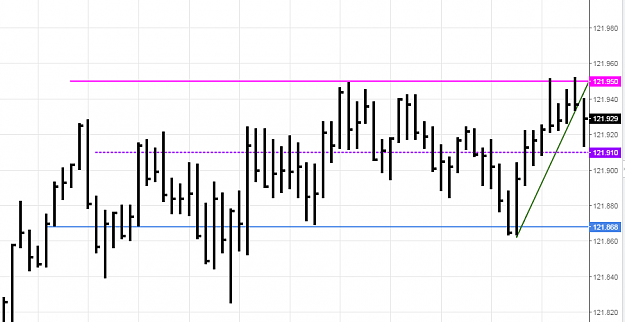
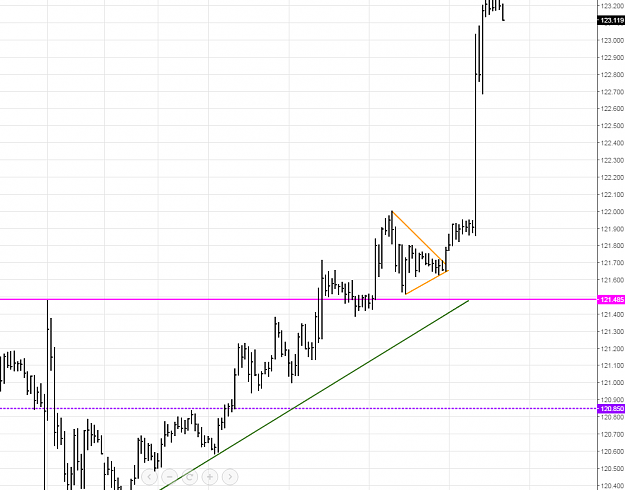
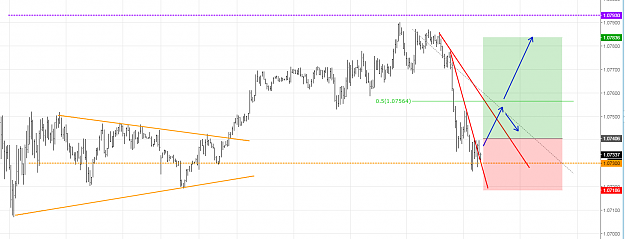
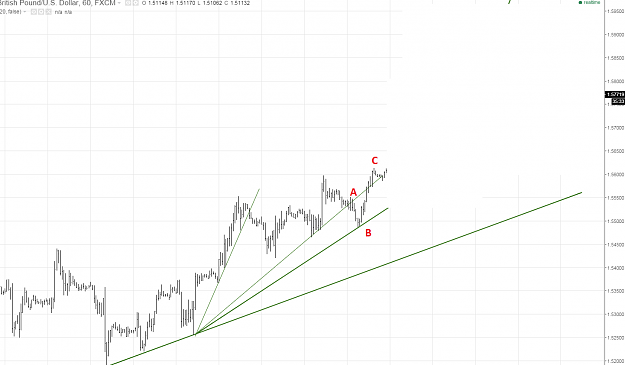
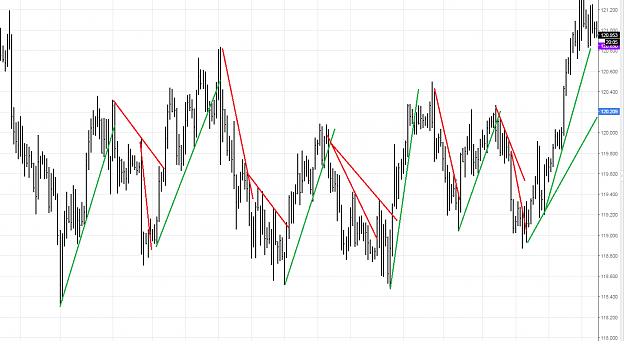
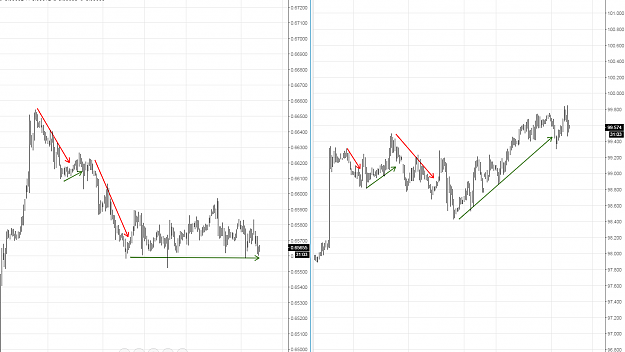
A) Breakouts
breakouts occure out of ranges and or support and resistance levels , breakouts can be played aggressively or more safer if ones waits for a retracement after a breakout
, as often breakouts are faded by institutions and to catch most on the wrong side , ie fakeouts, and shakeouts, one can also lookout on any signs of absorbtion or
consumption to position oneself well ahead of the breakout , this requires some skill to read price , but riskwise its on the safer side compared to an aggressive entry.
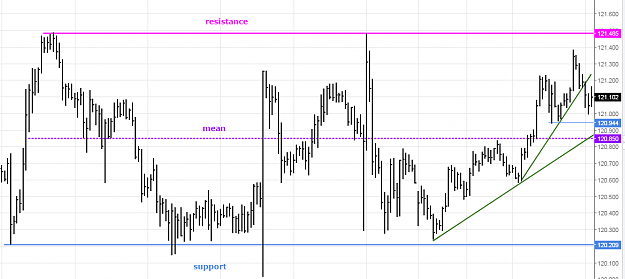
Attached Image (click to enlarge)
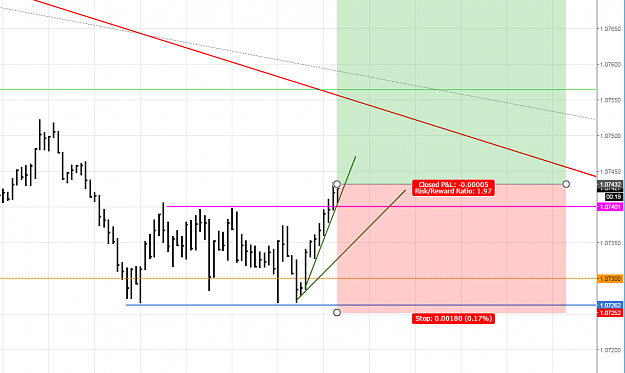
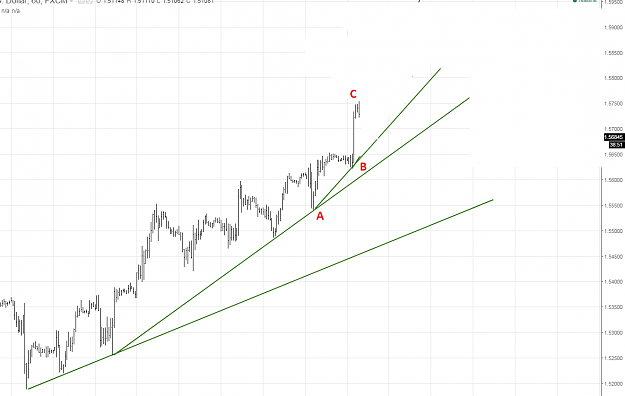
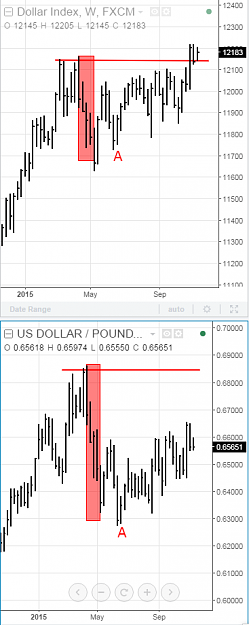
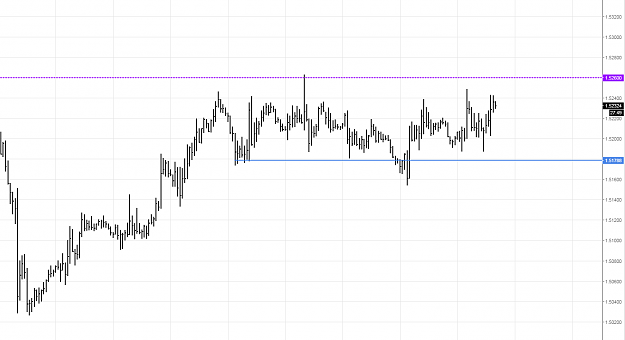
B) Retracement
The first pullback after a break through support or resistance or a V reversal , a retracement can either be seen after a breakout or in any form of absorbtion and
consumption aswell as at the mean of the ranges and in trends preferably into former support and resistance levels and 50% levels , these are continuation moves.
Attached Image
Attached Image (click to enlarge)
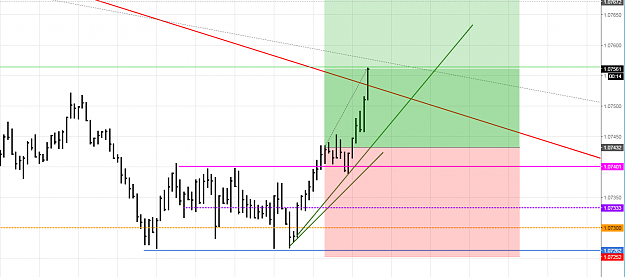
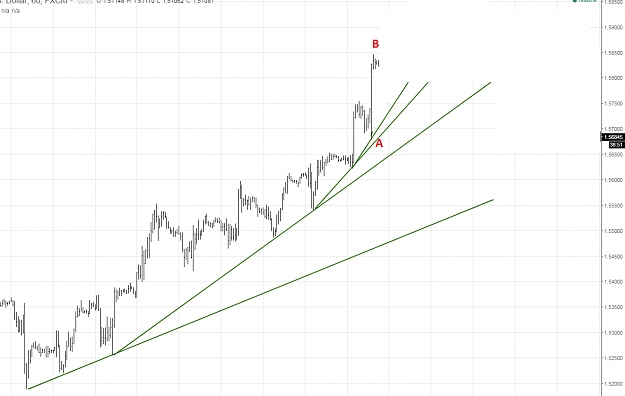
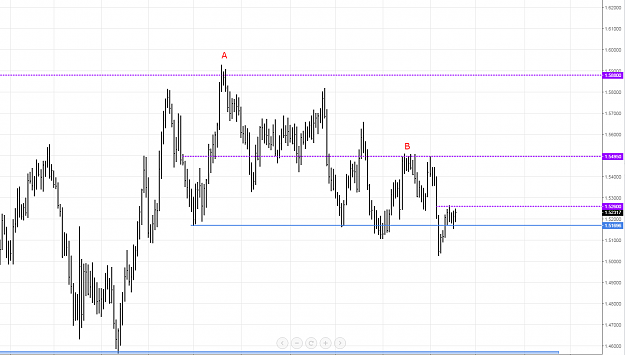
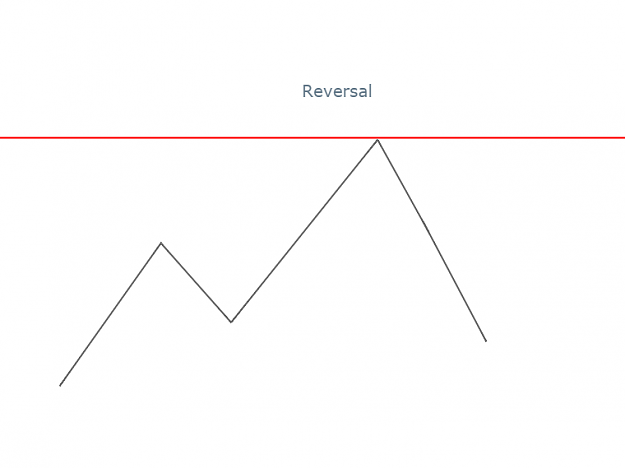
C) Reversal
A bounce of or rejection of the upper or lower limit of a trading range. aswell as of overbought , oversold levels of trading channels , any reversal may add to weakness
or strenght , its also the result of a buying or selling climax
Attached Image (click to enlarge)