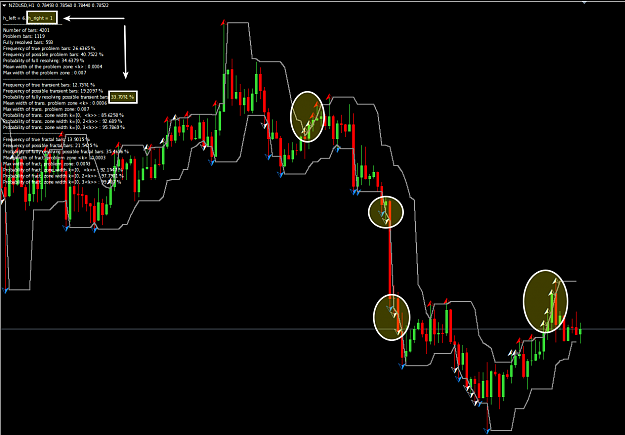
This is the heart of the matter and it works on any time frame. I will prove this to you. {image}
Ignored
Attached Image
This has always intrigued me so maybe we could initiate some discussion around this to finally clear this up. I don't have a degree in mathematics or anything like that but have studied these statements.
Are we really talking about two propositions?
My basic understanding is that the first statement (Proposition 1) is saying that price is almost surely recurrent. So there would be k and h figures that someone could pick that would make that statement true. So in theory every price on the chart could be recurrent if we wait long enough. The problem is that we can't.
I believe the second statement (Definition 2) based on my basic understanding again is that this is a definition of what it means to be recurrent. So explaining what price has to do to be recurrent.
Does any one agree/disagree with this?
It would be interesting to have a discussion around this and with our collective minds come to a conclusion.
Regards
Neio
An expert is a man who has made all the mistakes which can be made
{quote} {image} This has always intrigued me so maybe we could initiate some discussion around this to finally clear this up. I don't have a degree in mathematics or anything like that but have studied these statements. Are we really talking about two propositions? My basic understanding is that the first statement (Proposition 1) is saying that price is almost surely recurrent. So there would be k and h figures that someone could pick that would make that statement true. So in theory every price on the chart could be recurrent if we wait long enough....
{quote} {image} This has always intrigued me so maybe we could initiate some discussion around this to finally clear this up. I don't have a degree in mathematics or anything like that but have studied these statements. Are we really talking about two propositions? My basic understanding is that the first statement (Proposition 1) is saying that price is almost surely recurrent. So there would be k and h figures that someone could pick that would make that statement true. So in theory every price on the chart could be recurrent if we wait long enough....
Ignored
Thanking you for making these statements more clear for me. I was never to good at math.
Life's Good & Why Wouldn't It Be? Im a Pirate After All!
{quote} {image} This has always intrigued me so maybe we could initiate some discussion around this to finally clear this up. I don't have a degree in mathematics or anything like that but have studied these statements. Are we really talking about two propositions? My basic understanding is that the first statement (Proposition 1) is saying that price is almost surely recurrent. So there would be k and h figures that someone could pick that would make that statement true. So in theory every price on the chart could be recurrent if we wait long enough....
{quote} {quote} OK now all clear. I thought EURUSDD was saying the opposite hence my lack of understanding. Thanks. {quote} Good indicator and good insights! Right on time for new experiments with k Thanks for sharing. {quote} Looking forward it. {quote} Proposition 1 seems in conflict with the example setup (http://www.forexfactory.com/showthread.php?p=7681717#post7681717) EURUSDD showed us, where he clearly stated k is the height of the transient zone.
{quote} {image} This has always intrigued me so maybe we could initiate some discussion around this to finally clear this up. I don't have a degree in mathematics or anything like that but have studied these statements. Are we really talking about two propositions? My basic understanding is that the first statement (Proposition 1) is saying that price is almost surely recurrent. So there would be k and h figures that someone could pick that would make that statement true. So in theory every price on the chart could be recurrent if we wait long enough....
Ignored
My understanding of Prop 1. is not that every price will be recurrent (yes most are given time) but more rather, prices within the certain h,k figures relative to a chosen time frame. That's where the magic is.
The definition statement is defining price recurrence relative to h on a chosen time frame.
{quote} {image} This has always intrigued me so maybe we could initiate some discussion around this to finally clear this up. I don't have a degree in mathematics or anything like that but have studied these statements. Are we really talking about two propositions? My basic understanding is that the first statement (Proposition 1) is saying that price is almost surely recurrent. So there would be k and h figures that someone could pick that would make that statement true. So in theory every price on the chart could be recurrent if we wait long enough....
Ignored
If any price is almost surely recurrent within price+k and price-k for the next h bars then theoretically we could enter the market at any given time (except strong trends or near confirmed transient zones). But I guess it doesn't really work that way.
{quote} {image} This has always intrigued me so maybe we could initiate some discussion around this to finally clear this up. I don't have a degree in mathematics or anything like that but have studied these statements. Are we really talking about two propositions? My basic understanding is that the first statement (Proposition 1) is saying that price is almost surely recurrent. So there would be k and h figures that someone could pick that would make that statement true. So in theory every price on the chart could be recurrent if we wait long enough....
Ignored
Thank you for all your comments so far...
It appears we are all in agreement. I just wondered as a couple of times I have heard people mention a second proposition but in my mind their is only one proposition with a definition. According to Eurusdd we only need that proposition to earn $$$ but we have to overcome times when prices are transient which normally happens when price is trending strongly.
An expert is a man who has made all the mistakes which can be made
|
Additional Username
|
Joined Apr 2014
|1,220 Posts
correct point of view but wrong result
%33 is related with one on the left one on the right of TZ bar.
in our case we have 10 bars untouched on the left & now we are counting the ones on the right
here we need the statistics of how TZ s are broken.
eg
when we have 10 bars completed on the left & when we start counting on the right when TZ is broken
on the 1st bar or 2nd etc..............
when we have that stat then we can talk on probability
{quote} {image} {quote} If any price is almost surely recurrent within price+k and price-k for the next h bars then theoretically we could enter the market at any given time (except strong trends or near confirmed transient zones). But I guess it doesn't really work that way.
correct point of view but wrong result %33 is related with one on the left one on the right of TZ bar. in our case we have 10 bars untouched on the left & now we are counting the ones on the right here we need the statistics of how TZ s are broken. eg when we have 10 bars completed on the left & when we start counting on the right when TZ is broken on the 1st bar or 2nd etc.............. when we have that stat then we can talk on probability {quote}
Ignored
I think you didn't see that my chart has h_left set to 6 so not 1 bar left. It is 6 bars left and then the probability of breaking the PTZ on the next bar.
For other h_left=10 and h_right=1 should be similar, haven't checked, but thanks to the indi from kprsa is it easy to find out.
correct point of view but wrong result %33 is related with one on the left one on the right of TZ bar. in our case we have 10 bars untouched on the left & now we are counting the ones on the right here we need the statistics of how TZ s are broken. eg when we have 10 bars completed on the left & when we start counting on the right when TZ is broken on the 1st bar or 2nd etc.............. when we have that stat then we can talk on probability {quote}
in our case we have 10 bars untouched on the left & now we are counting the ones on the right here we need the statistics of how TZ s are broken. eg when we have 10 bars completed on the left & when we start counting on the right when TZ is broken on the 1st bar or 2nd etc.............. when we have that stat then we can talk on probability {quote}
Ignored
Hi MAM.Trader,
You are of course very welcome to share your code where you do the procedure you think is correct.
|
Additional Username
|
Joined Apr 2014
|1,220 Posts
no I didnt
you are right
its set 6 to 1
ok
fair
kprsa (http://www.forexfactory.com/kprsa) what does it mean "fully resolving possible ransistent bars" ?
my code does no calculate that way. Iit only caculates +-n bar span starting from 1 means
when I set n=50 it caculates all probabilites from H=+-1 to H=+-50
now after post of juri I should fix the code.
unfo my codes are embeaded into my trading code. an EA. so its not possible to share it as an indicator. but if you want to see the code I can share it with you as a raw data (text document) while your code is open source
{quote} I think you didn't see that my chart has h_left set to 6 so not 1 bar left. It is 6 bars left and then the probability of breaking the PTZ on the next bar. For other h_left=10 and h_right=1 should be similar, haven't checked, but thanks to the indi from kprsa is it easy to find out.
{quote} I think you didn't see that my chart has h_left set to 6 so not 1 bar left. It is 6 bars left and then the probability of breaking the PTZ on the next bar. For other h_left=10 and h_right=1 should be similar, haven't checked, but thanks to the indi from kprsa is it easy to find out.
Ignored
Hi,juriFX
if you can show us more cases how to use the indi from kprsa?
{quote} Thank you for all your comments so far... It appears we are all in agreement. I just wondered as a couple of times I have heard people mention a second proposition but in my mind their is only one proposition with a definition. According to Eurusdd we only need that proposition to earn $$$ but we have to overcome times when prices are transient which normally happens when price is trending strongly.
Ignored
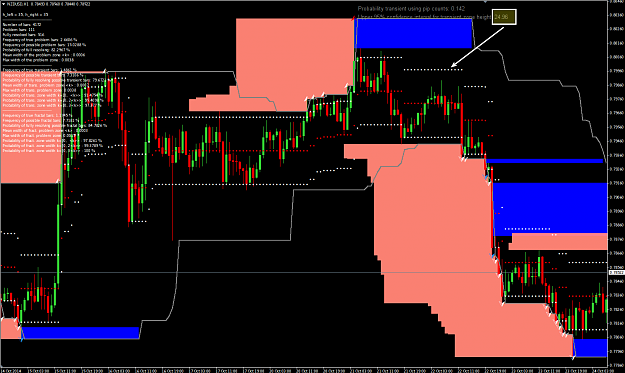
Look at this chart, could be something worth exploring out