Hi
As you know, it takes much time to get oneself into the nature and behavior of currency pairs. Exporting your data into excel, making the analysis, endlessly rolling your charts back and forth and measuring swing with crosshair on multiple timeframes, etc......
Wouldnt it be nice to have a tool to quickly drill yourself deep into the insides of the pairs you prefer. I think I may have got some ideas of how to do this. BUT Im not a coder so I dont have a clue if it is possible to do this or not. Anyways I think it could make a really good tool to fast screening statistics & probabilities behind any currency pair.
Im very interested about other statistical indicators & tools for screening the statistics behind pairs so if you have some and are ready to share them, please attach them to the thread.
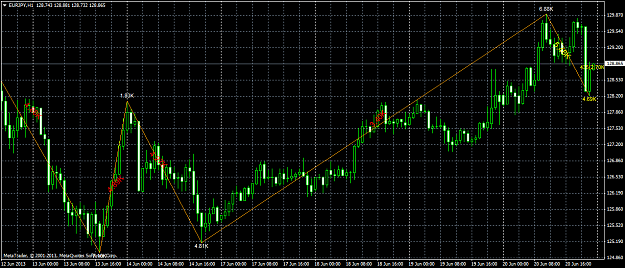
I also have a preliminary idea of a potential tool to do this in a more simple way. So if possible could someone please code an indicator, which shows the statistics behind zig zag swings. The normal zig zag indicator on MT4. Maybe we could also develop it in a cooperation.
I think at least the folowing features would be preferable
- adjustable amount of zz swing history.
- adjustable starting & ending date for the analysis
- adjustable times (so that you could analyse the historical swings on eg. a particular session)
- could be used in any timeframe
- how many swings on the average on an adjustable time (like on NY session)
- the average range of swings on pips (upswings & downswings separated)
- the midpoint (50%) of swings on pips (upswings & downswings separated)
- average time of swings (upswings & downswings separated)
- starting & ending times of swings in the form on a deviation (bell curve type of output)
- results to charts with adjustable place on a chart (like on which corner of the chart the results will be presented)
- adjustable indicator? (so that you could use eg. rsi swings instead of zig zag if you like)
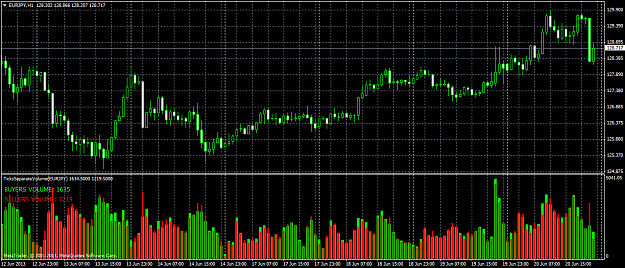
- combined volume from candles in a swing (from the first to the last on a single zig zag swing up or down)
Update 28.6,2013: Heres a version of filewrite function which collects adjustable amount of data from your chart on a timeframe you prefer. Big thumbs up for Hayseed & others for the help
1. Put filewrite2 in your mt4/experts/scripts folder
2. Open the file in metaeditor.
3. Read the instructions in a script, adjust the amount of data you need and compile it.
4. Open MT4 chart on a pair & timeframe you desire and drag & drop the script into the chart.
5. Scipt produces a file named "ma" to the experts/scripts folder.
6. Open it on metaeditor, select all => copypaste to excel.....
Columns in the data are: Date, Time, Dayofweek (1=mo --> 6=su), Open, High, Low, Close, Volume, Zig Zag, Uptick Volume, Downtick volume, ATR 14 (average true range).
Excel is a spreadsheet, and it gets slow and demands a lot of disk space & calculating power if the amount of data is large. Max amount of data that can be exported into a single sheet is 1048576 rows. Many of the graphs & pivot table functions are limited after 32000 rows.
Update 13.7.2013 Here is the first version of the spreadsheet. It has some tables & statistics of ZZ swings as well as some others. Feel free to modify it as you like and present your findings here. It is not fully automated and you have to do some operations manually, but still it beats the hell out of measuring swing sizes with crosshair, etc. There is 500 rows of EJD1 data only for demo purposes as it is pretty much the max size of the file that can be acctached here. Because of the small sample size some of the tables seem awkward, but they should get better as you bring more data and update them according to instructions.
Use the enclosed filewrite script to import your data into it. It contains macros and they should be enabled for it to work properly. Pivot tables you have to update manually as the size of the source data have to be changed manually on each pivot table. There are instructions of how to do this on the first sheet of the ZZstats.xls. Read the other instructions also carefully!!!
With the pivot table tool you can analyse the data many ways by using filters and changing columns on the existing tables, etc so you should be able to use them in order to get the most out of this tool.
As there are many versions of MsExcel around and they all have their particular feaures & settings, I dont take any responsibility for the spreadsheet functioning. Feel free to develop the tool and/or make any comments, suggestions or development ideas though.
As you know, it takes much time to get oneself into the nature and behavior of currency pairs. Exporting your data into excel, making the analysis, endlessly rolling your charts back and forth and measuring swing with crosshair on multiple timeframes, etc......
Wouldnt it be nice to have a tool to quickly drill yourself deep into the insides of the pairs you prefer. I think I may have got some ideas of how to do this. BUT Im not a coder so I dont have a clue if it is possible to do this or not. Anyways I think it could make a really good tool to fast screening statistics & probabilities behind any currency pair.
Im very interested about other statistical indicators & tools for screening the statistics behind pairs so if you have some and are ready to share them, please attach them to the thread.
I also have a preliminary idea of a potential tool to do this in a more simple way. So if possible could someone please code an indicator, which shows the statistics behind zig zag swings. The normal zig zag indicator on MT4. Maybe we could also develop it in a cooperation.
I think at least the folowing features would be preferable
- adjustable amount of zz swing history.
- adjustable starting & ending date for the analysis
- adjustable times (so that you could analyse the historical swings on eg. a particular session)
- could be used in any timeframe
- how many swings on the average on an adjustable time (like on NY session)
- the average range of swings on pips (upswings & downswings separated)
- the midpoint (50%) of swings on pips (upswings & downswings separated)
- average time of swings (upswings & downswings separated)
- starting & ending times of swings in the form on a deviation (bell curve type of output)
- results to charts with adjustable place on a chart (like on which corner of the chart the results will be presented)
- adjustable indicator? (so that you could use eg. rsi swings instead of zig zag if you like)
- combined volume from candles in a swing (from the first to the last on a single zig zag swing up or down)
Update 28.6,2013: Heres a version of filewrite function which collects adjustable amount of data from your chart on a timeframe you prefer. Big thumbs up for Hayseed & others for the help
1. Put filewrite2 in your mt4/experts/scripts folder
2. Open the file in metaeditor.
3. Read the instructions in a script, adjust the amount of data you need and compile it.
4. Open MT4 chart on a pair & timeframe you desire and drag & drop the script into the chart.
5. Scipt produces a file named "ma" to the experts/scripts folder.
6. Open it on metaeditor, select all => copypaste to excel.....
Columns in the data are: Date, Time, Dayofweek (1=mo --> 6=su), Open, High, Low, Close, Volume, Zig Zag, Uptick Volume, Downtick volume, ATR 14 (average true range).
Excel is a spreadsheet, and it gets slow and demands a lot of disk space & calculating power if the amount of data is large. Max amount of data that can be exported into a single sheet is 1048576 rows. Many of the graphs & pivot table functions are limited after 32000 rows.
Update 13.7.2013 Here is the first version of the spreadsheet. It has some tables & statistics of ZZ swings as well as some others. Feel free to modify it as you like and present your findings here. It is not fully automated and you have to do some operations manually, but still it beats the hell out of measuring swing sizes with crosshair, etc. There is 500 rows of EJD1 data only for demo purposes as it is pretty much the max size of the file that can be acctached here. Because of the small sample size some of the tables seem awkward, but they should get better as you bring more data and update them according to instructions.
Use the enclosed filewrite script to import your data into it. It contains macros and they should be enabled for it to work properly. Pivot tables you have to update manually as the size of the source data have to be changed manually on each pivot table. There are instructions of how to do this on the first sheet of the ZZstats.xls. Read the other instructions also carefully!!!
With the pivot table tool you can analyse the data many ways by using filters and changing columns on the existing tables, etc so you should be able to use them in order to get the most out of this tool.
As there are many versions of MsExcel around and they all have their particular feaures & settings, I dont take any responsibility for the spreadsheet functioning. Feel free to develop the tool and/or make any comments, suggestions or development ideas though.
Attached File(s)