Hello,
This system uses the trend strength indicator on the daily chart as a filter for the trend strength indicator on H4 for entries. If you have the patience to wait for the proper setup and use correct money management, you will make a profit with this.
Setup
Charts:
1. Trend Strength Indicator. (orange)
2. 3EMA attached to indicator. (red)
Entry
On the daily chart, decide which way the trend strength indicator is showing the trend. Move to the H4 chart and wait for the trend strength indicator to go above or below the 0 line, opposite of the last cross on the daily chart. Enter when the trend strength indicator crosses the 3ema in agreement with the daily chart.
Important
Do not take the trade if the exit goal is not at least 2:1.
Stop Loss
If Short: Place stop loss at most recent swing high.
If Long: Place stop loss at most recent swing low.
Exit
Place take profit at the next point of support or resistance on the H4 Chart.
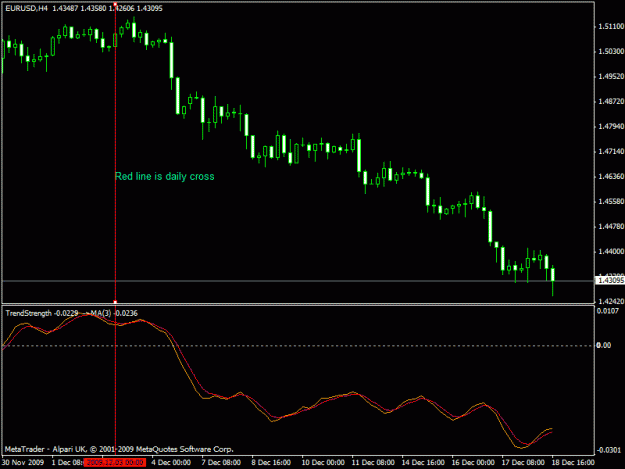
Daily Chart
Red line shows cross to show trend is down. After the vertical red line, we only take short entries on H4.
http://img187.imageshack.us/img187/1102/daily.gif
Click to enlarge
H4 Chart
Gold lines show our short entries. (Red line from Daily Chart)
http://img96.imageshack.us/img96/8949/68920538.gif
Click to enlarge
Conclusion
The real key to this or any strategy is using proper money management. This system will win more than it looses, and it will make you a profit, but only if you use sound money management techniques.
I'll try and post some entries this system generates over the next few days or so. Let me know if you have any questions. Indicator and template attached below.
Good Luck,
CGiant
This system uses the trend strength indicator on the daily chart as a filter for the trend strength indicator on H4 for entries. If you have the patience to wait for the proper setup and use correct money management, you will make a profit with this.
Setup
Charts:
1. Trend Strength Indicator. (orange)
2. 3EMA attached to indicator. (red)
Entry
On the daily chart, decide which way the trend strength indicator is showing the trend. Move to the H4 chart and wait for the trend strength indicator to go above or below the 0 line, opposite of the last cross on the daily chart. Enter when the trend strength indicator crosses the 3ema in agreement with the daily chart.
Important
Do not take the trade if the exit goal is not at least 2:1.
Stop Loss
If Short: Place stop loss at most recent swing high.
If Long: Place stop loss at most recent swing low.
Exit
Place take profit at the next point of support or resistance on the H4 Chart.
Daily Chart
Red line shows cross to show trend is down. After the vertical red line, we only take short entries on H4.
http://img187.imageshack.us/img187/1102/daily.gif
Click to enlarge
H4 Chart
Gold lines show our short entries. (Red line from Daily Chart)
http://img96.imageshack.us/img96/8949/68920538.gif
Click to enlarge
Conclusion
The real key to this or any strategy is using proper money management. This system will win more than it looses, and it will make you a profit, but only if you use sound money management techniques.
I'll try and post some entries this system generates over the next few days or so. Let me know if you have any questions. Indicator and template attached below.
Good Luck,
CGiant
Attached File(s)