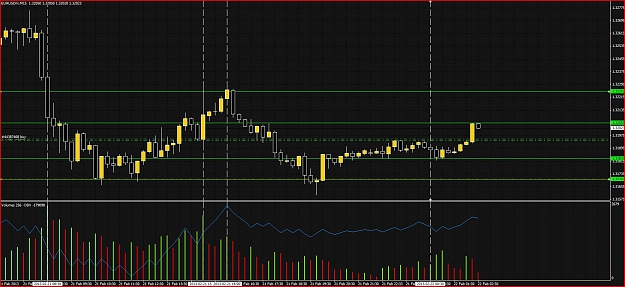
Hi Tom, in my view, the first arrow was not a good indicator to short. Previous 3 candle prices was up, volume up, a bias to long entry. But the second entry was good because there was a price down from determinator candle to the next candle with volume up, a bias to short entry.
I hope we can get another opinion, especially from Spud.
I hope we can get another opinion, especially from Spud.
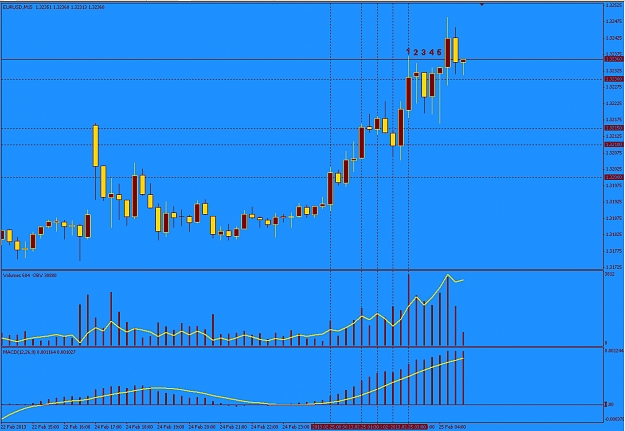
DislikedI first entered short while the candle was still developing (ignoring Spudfyre's instructions
- won't do it again) @1.3460 and got stopped out for a 15 pips loss. I entered again at the end of the candle where I was stopped and took a 15 pips profit that could have been much more ( I had to leave the PC therefore I set the TP to 15 pips)
Regards to allIgnored
Pursue the best and share to others!