►►Financial Markets Observatory Lab.◀◀
❖ H! ALL ❖
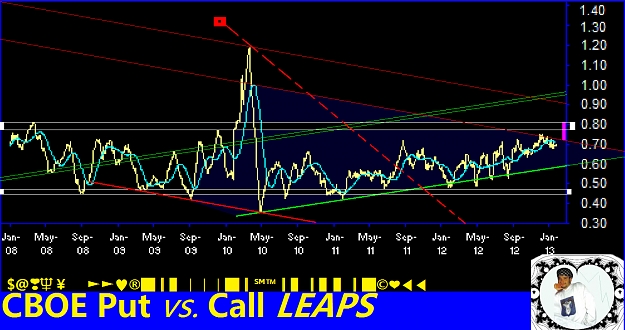
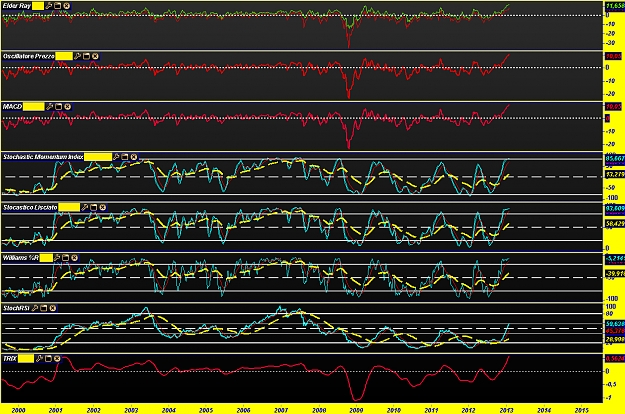
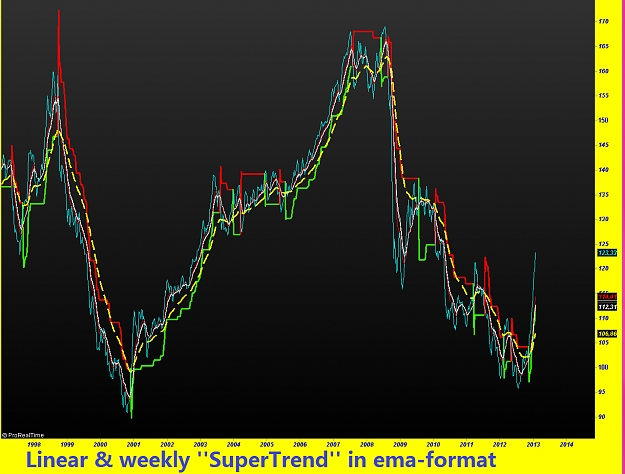
Some notes/charts about IFO Indicators.
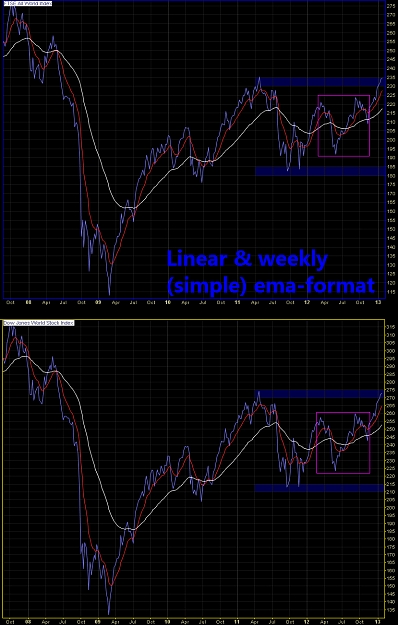
General stocks-benchmarks as follows:
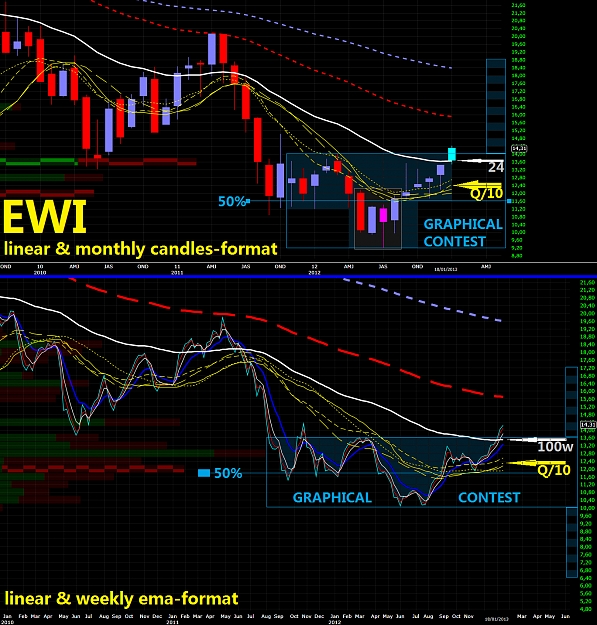
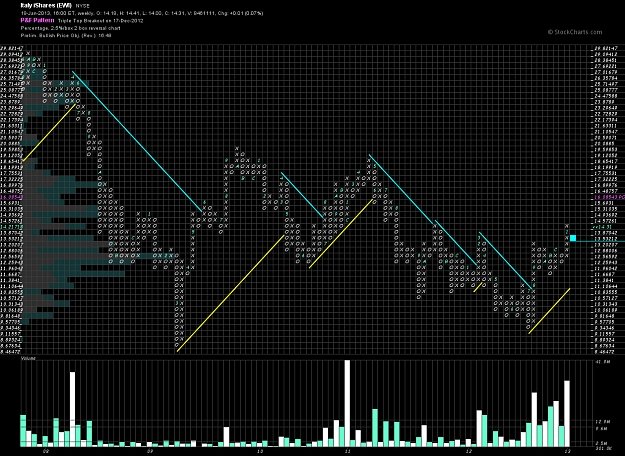
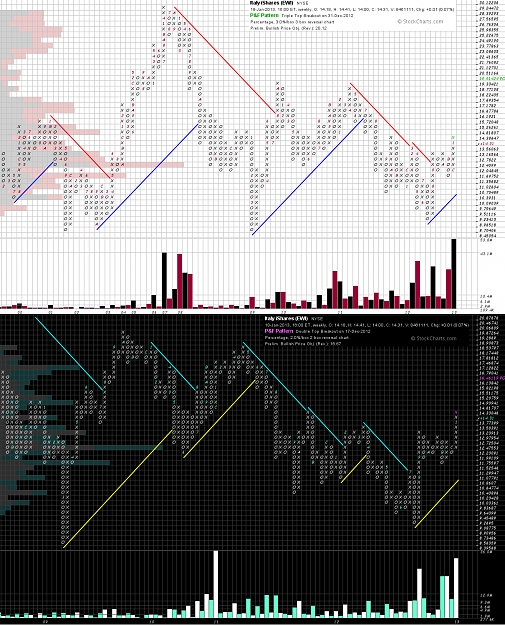
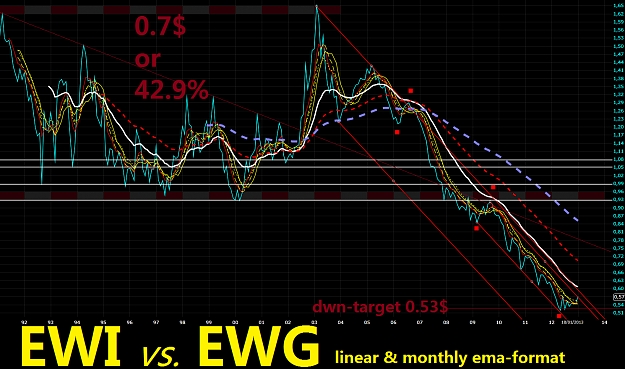
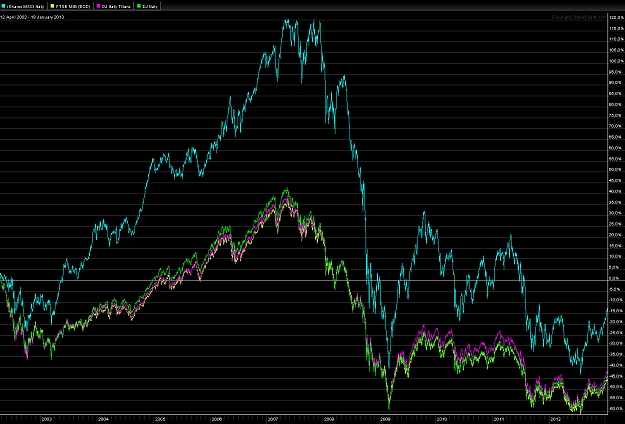
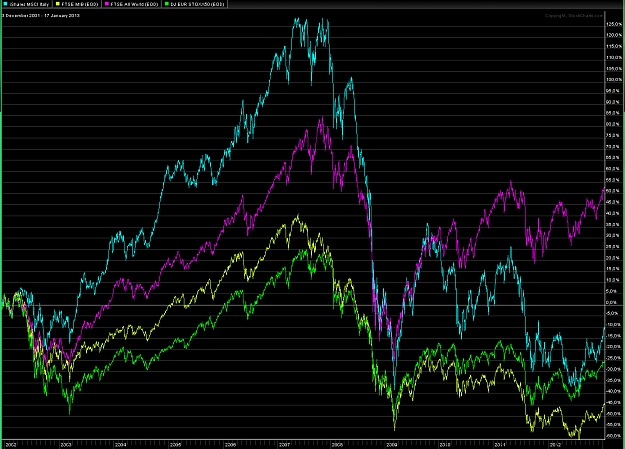
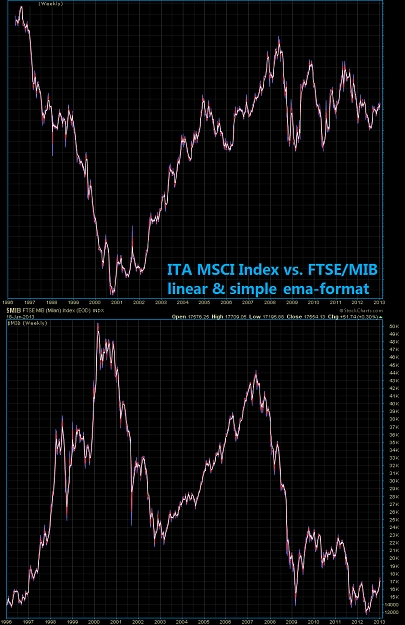
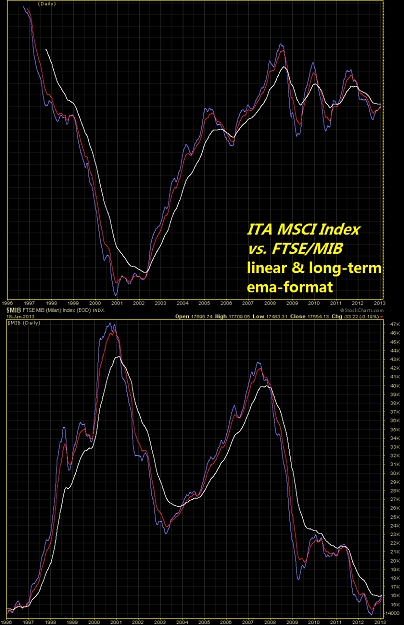
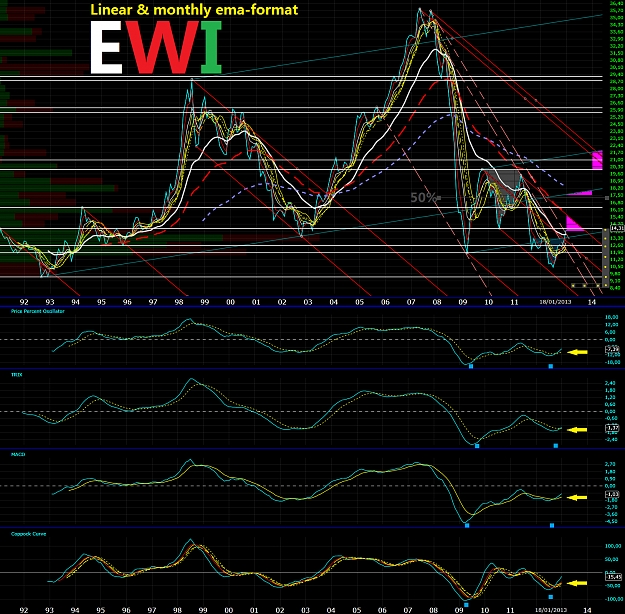
► European benchmarks (general; single countries);
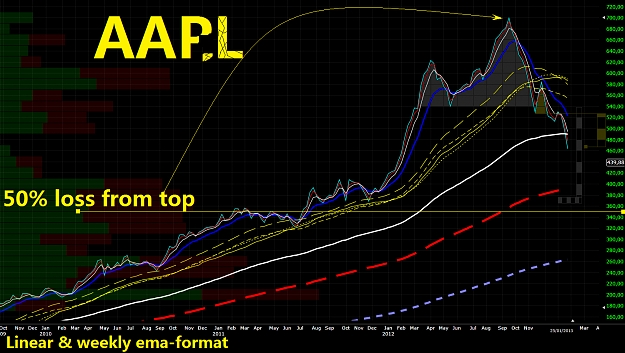
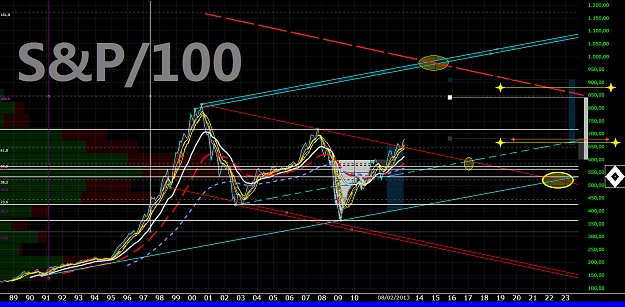
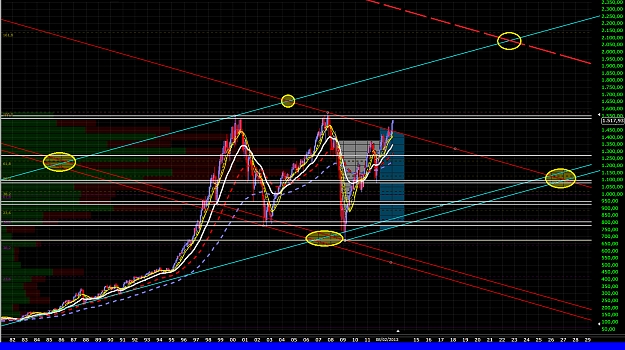
► main U.S. stocks-benchmarks (charts & notes: QQQ; ONEQ; DIA; OEF; SPY);
► global U.S. stocks-benchmarks (charts & notes: EUSA; ITOT; IWB; IWV; IYY; TMW);
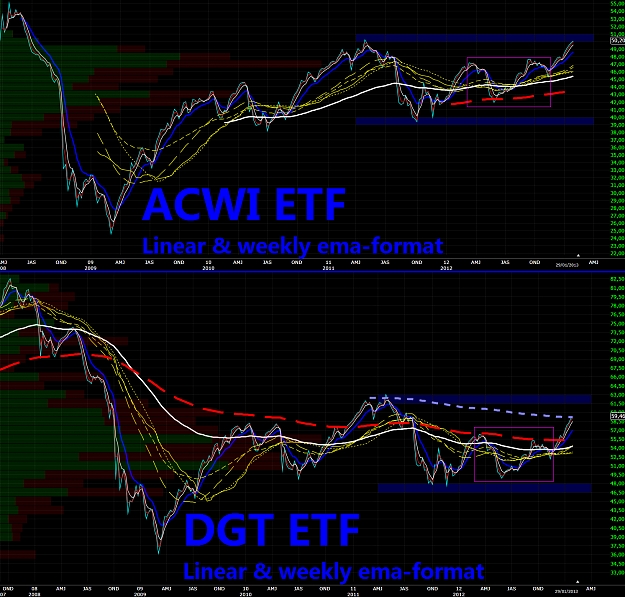
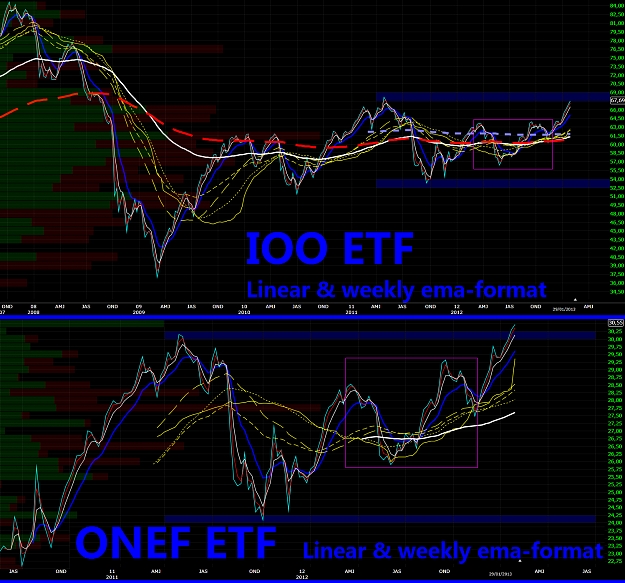
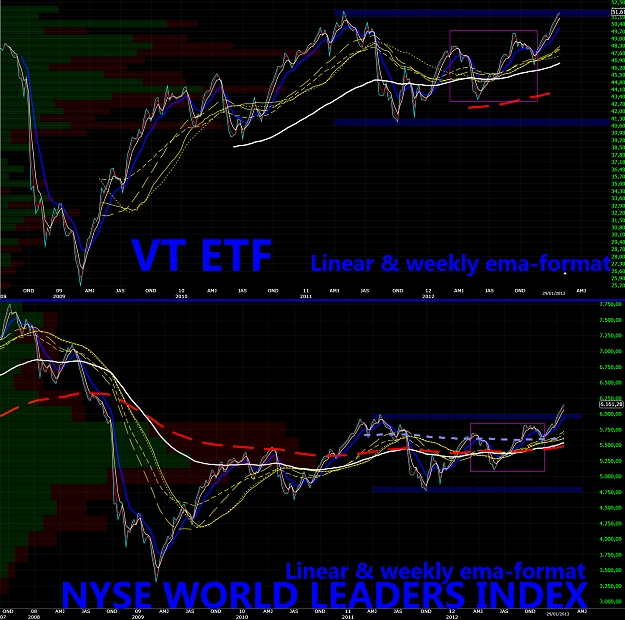
► global World stocks-benchmarks (charts & notes: ACWI; DGT; IOO; NYSE W.L.I.; ONEF; VT).
❖ IFO Previous studies/charts: oct.2011 -- jan.2012 -- apr.2012 -- jul.2012.
❖ ZEW Previous studies/charts sep.2011 -- jul.2012.
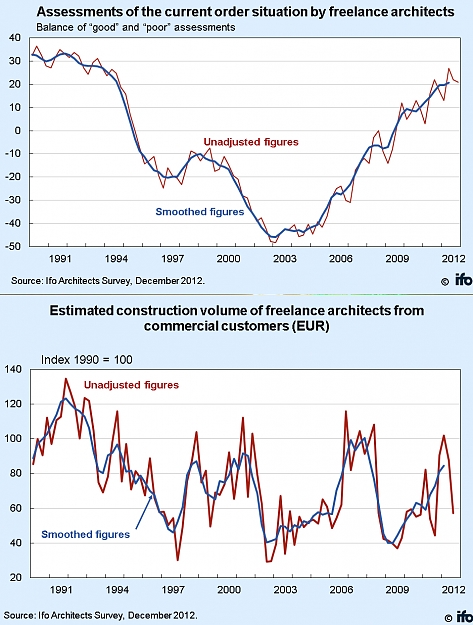
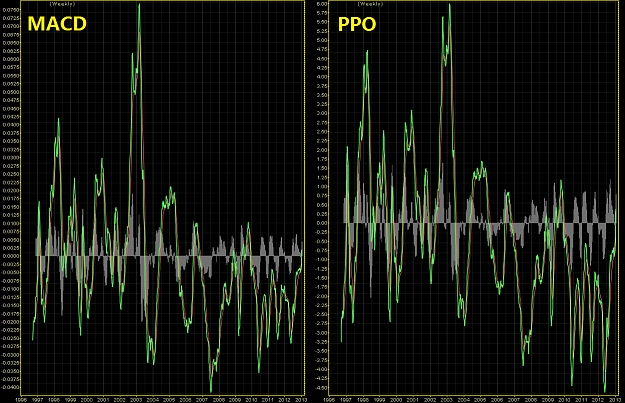
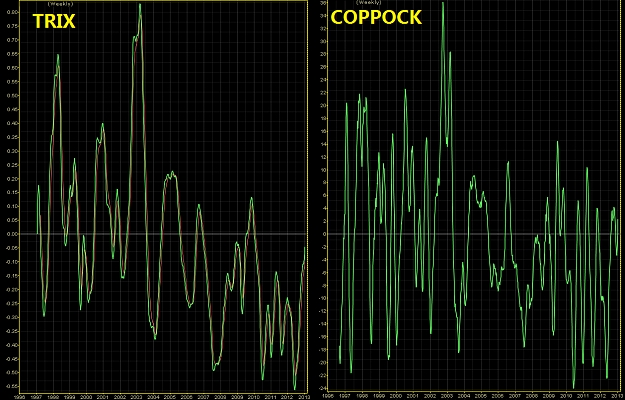
Some ⒾⒻⓄ curves (Architects Survey).
Sorry for my bad English. I hope that this post is at least minimally useful.
☻/♪ ❖ EARTH.pk, Alert 2.O !!! ❖
/▌
/|
Tuned on main trend, but follows short-medium term signs from underlying prices, for a correct & real-time set-up.
It is very important do not anticipate the main trend of the underlying financial instruments.
ⒾM☢ ℬy $@❣♆¥ ►►♥
K€$ADDhAPhA'pe'KAMPA': Bunda-Bunda €MP¥R€ ❣!❣
Attached Image (click to enlarge)