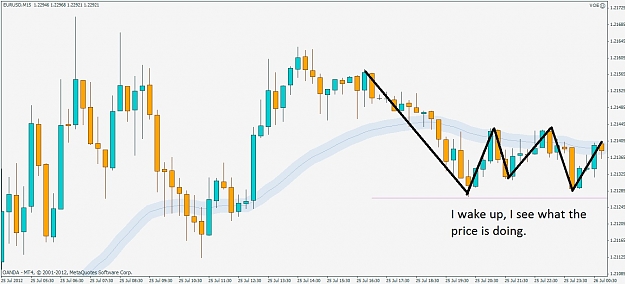
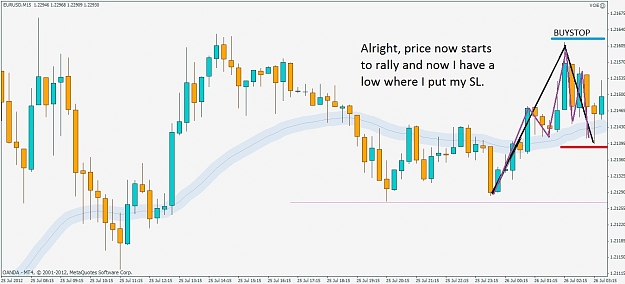
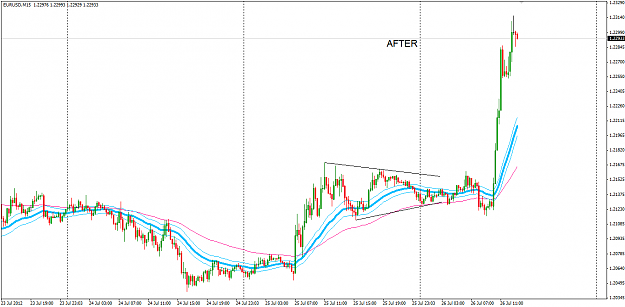
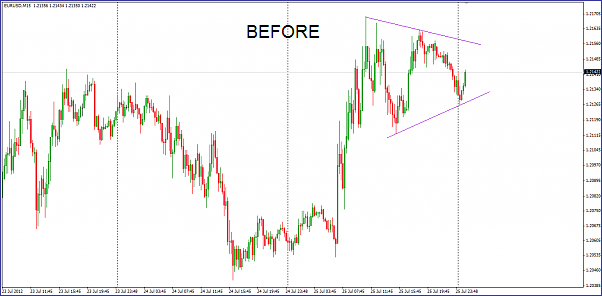
DislikedI see EU potential breakout after price contraction for many hours.
Those seeing H4 chart GMT00 may see several inside bars pattern.
Also on H4, overall USD strength show early sign of weakness ...still early.
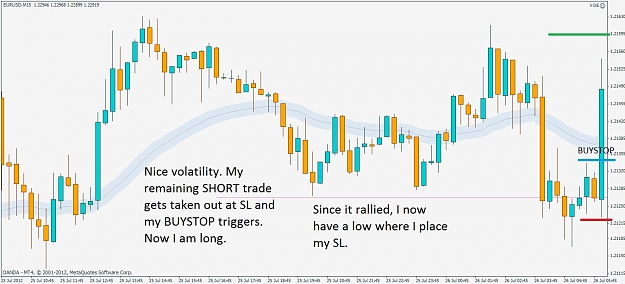
Today Draghi may set things into motion. I'll be careful when swing trading...with short AU,EU,GU long UCHf,UCad
Trade Well!Ignored
I posted the M15 chart with trendlines to show the price contraction and the potential breakout. Those who look at H4 can also see the IB pattern.
But I follow one rule:
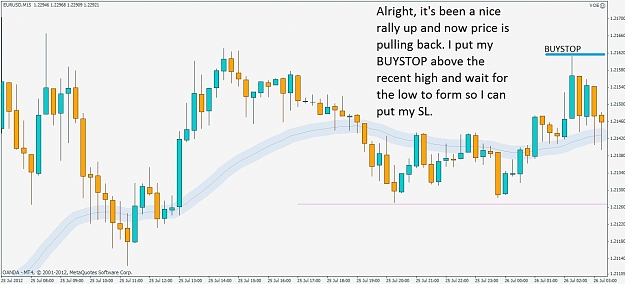
price above EMA34 above EMA89 ...BUY ONLY!
price below EMA34 below EMA89 ... SELL ONLY!
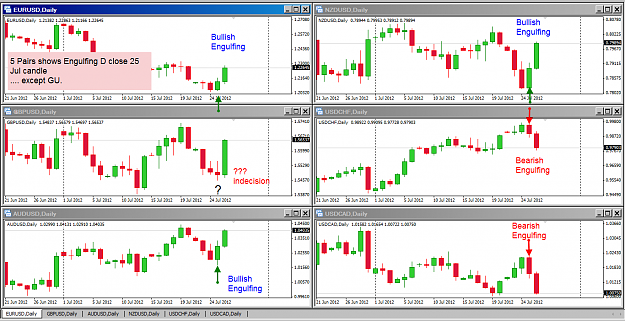
You look at all USD pairs today, 5 pairs went the "correct way" if we follow this rule. GU was a No-Go trade.
When I said about overall USD weakness I did not say it is reference to EU only. I look at the price of 6 USD pairs - EUR,GBP,AUD<NZD.CHF and CAD.
I look at the price correlation on H4 becasue I am a swing trader.
I also look at D chart for the D candle close to see if there was a strong bullish or brearish close. Also for D candle patterns. See attached D chart compare below. This help me decide on my intraday trading.
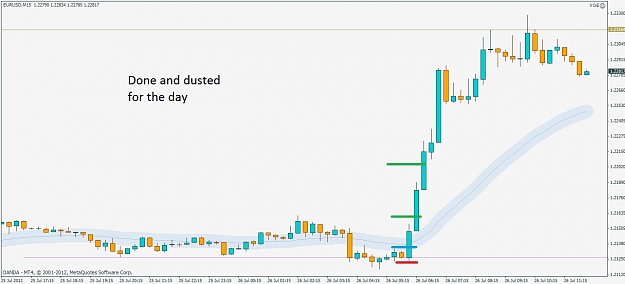
Well, as it turn out today ... I am right.
But tomorrow, I maybe wrong.
We never know. But we are all right until the market prove us wrong.
Good Trading!
Attached Image(s) (click to enlarge)
Attached Image
Honesty is a very expensive gift. You wont find it in cheap people.WBuffett
1