You don't need fractals to show you the swings, all you have to do is to look for HH, HL, LL, LH......you can more than some simple arrows that in RM situation will show only confusion !
All the order are put bellow/above the closer level and always after the candle is close !...If you find it no clear..just let me know !
The cable is not in good moment for trading right now, as the pair is in bullish trend with sellers getting in and buyers making taking profit....it is a good moment for MM !
Ignored
Thanks again FXGroup- really appreciate you helping my understanding on this!
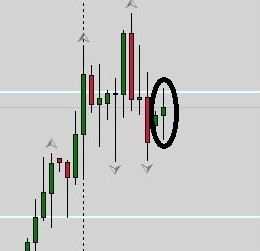
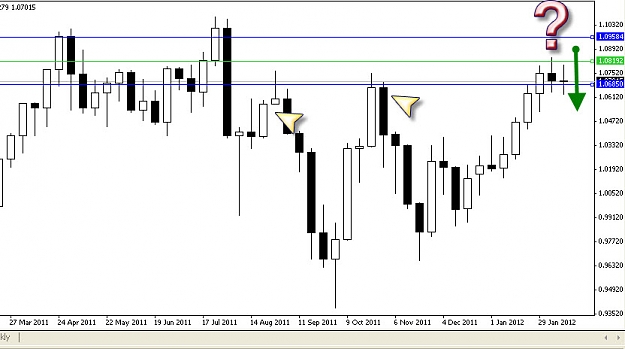
I understand the importance of placing the order after the close. I was wondering more about whether a candle pattern was required on the D to trigger your entry. For example- say the candle circled in black was closed and that we were in a M / W DT and wanted to take this short trade- would you trade a break of the low -or would you need to see a candle pattern like the one that actually came about?
Attached Images
pessimism of the intellect and optimism of the will
|
Commercial Member
|
Joined Nov 2010
|1,178 Posts
The black circled candle is a doji that shows me a retest of the RM to the left, so a battle between sellers and buyers for the RM and not a confirmation, but just an information.
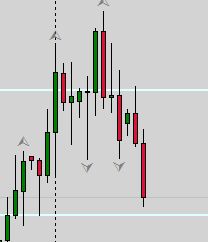
On the right chart, take a look at the price (sellers reaction) after the sellers took the control with the BEOB...THAT is a confirmation !
Which is more impt ? wick or body in the candle, but .....
I think we have to look beyond the candle so buyers and sellers ....
so in conclusion both . Isn't it ??? ;-)
|
Commercial Member
|
Joined Nov 2010
|1,178 Posts
Bouth ,bodies and tails are important, but crucial for me are the bodies and their close, meanwhile the tails give us very precious informations about price attempt, rejection, liquidity, etc.
Hi everyone.
This is my first post in this thread.
Thank Fxgroup for sharing this very useful knowledge. I read all thread and found a lot of interesting information. Now I need to practice it.
I noticed that you using both Static and Dynamic RM. And like you said you trading in RM from S to R and versus versa. My question is - what are you doing if you have different signal from different RM. For example Static RM shows you Buy (price closed above level), but Dynamic RM shows you Sell (bounce from level)? Do you prefer one or other or you staying out of market?
|
Commercial Member
|
Joined Nov 2010
|1,178 Posts
[quote=Gerkl;5393908]Hi everyone.
Quote
Disliked
This is my first post in this thread.
Thank Fxgroup for sharing this very useful knowledge. I read all thread and found a lot of interesting information. Now I need to practice it.
Hi Gerkl and thanks for your partecipation.
Quote
Disliked
I noticed that you using both Static and Dynamic RM. And like you said you trading in RM from S to R and versus versa. My question is - what are you doing if you have different signal from different RM. For example Static RM shows you Buy (price closed above level), but Dynamic RM shows you Sell (bounce from level)? Do you prefer one or other or you staying out of market?
Thank you.
I have more choises: to wait the P to turn back in satic RM in dynamic direction where the RM R will act as R again, to wait the dynamic and static to turn in the same direction or just as simple as you said to stay out of the market.
P.S. Nice to have you around, any question you have, feel free to ask !
I am learning here. Fxgroup and all, please help me to improve.
I have read each post very carefully. And now here is my first analysis following Fxgroup's style.
Everybody please feel free to teach me if you find i neglect or misundestand anything. Thanks in advance.
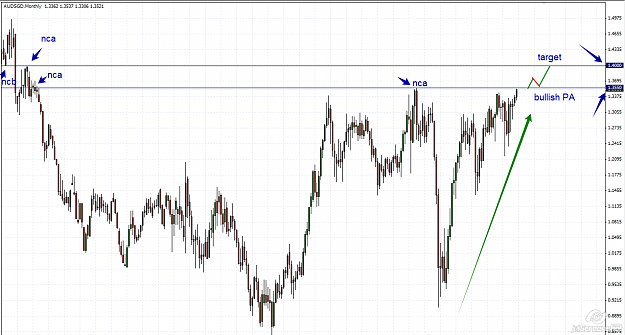
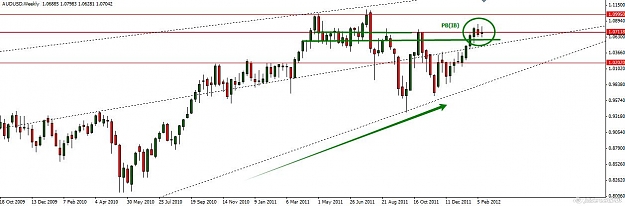
Month:
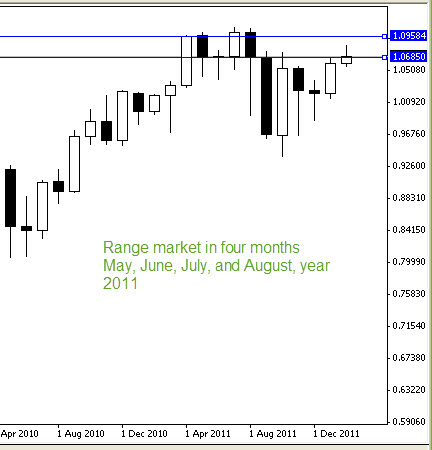
1) There was a range market last 4 month, from 2011 May to 2011 August, April may include
2) Now the price return to this range, reach the bottom line of the 1.0685, close of the May
To my understanding what i learned from this thread, i am expecting to short here, as it broke down the support and dropped hard and now retrace back
Weekly:
1) The week of Aug. 28, and Oct. 23, the price retraced twice and dropped twice, now it is the third time retrace into the range
2) I am trying to short inside the range, 1.0822, which is the open of the week of July 24, there is big resistance, so the first check point is there
, also confluence with round numer 1.0800 nearby
I am wondering whether i can make a short nearby 1.0822
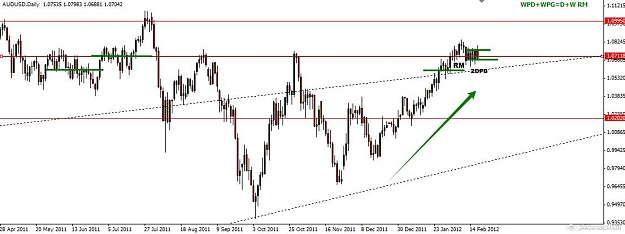
Daily:
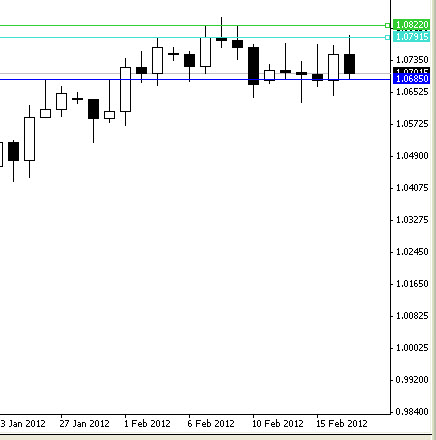
1) Feb. 8, there is a pin bar, later on a confirmed evening star or three bar reverse
2) From the daily, close of the Feb. 7th, 1.0793, there is a big resistance
3) I missed the first entry, so waiting for the retrace to 1.0793,
As fxgroup teached, a pending order, now it was filled.
The target would be the 1.0238, i.e. the close of the week of Nov. 27, 2011,
SL would be the 1.0850, the swing high of the week of Feb. 5.
If the range is broke up, then waiting for a retrace back and make a long.
Attached Image (click to enlarge)
Attached Images
Outcome is not important at all, but correct technique is what only matters
Thanks for reply. I guess I just need more practice to see the big picture.
I have another question to you if you don't mind. I can see that all your posts has almost clear chart with one or two lines on it. And you said that you watching different market. Sow my question is do you save all you previous drawings or do you redraw them every time from scratch. And how do you remember which pair (or other market) worth to keep eye on it ?
Actually, i would have the following learning by reading fxgroup's post in this thread
1) Month ranging
2) Broke down the ranging and dropped fast from the month ranging
3) Now retrace back to the month ranging
If i dont misunderstand, from the above three criterias, this would be a good short chance. Actually daily gives the confirmation.
The only issue is this is the third time retrace back, possibly broke up the ranging.
I like the logic way behind fxgroup's method, the AU actually is a good match to fxgroup's method
Dariusz, thanks for your response. But i cant find the logic behind your figures. will you please explain what would be the logic from your figures, i mean following Fxgroup's method. You may have a clear explanation to the logic behind your figures, thanks!
Thanks!
Outcome is not important at all, but correct technique is what only matters
|
Commercial Member
|
Joined Nov 2010
|1,178 Posts
[quote=szpowerx;5396944]
Quote
Disliked
Hi everyone,
I have read each post very carefully.
Hi szpowerx and welcome !
Quote
Disliked
I am wondering whether i can make a short nearby 1.0822
All the TF are bullish and D is in RM above the M level.
Just a personal consideration.....I see many traders waiting the bullish price to reach to a R level in order to short a certain pair...but this means to pick the tops and bottoms and we just don't want this, because is very very risky...and why would we short a bullish pair ?...woundn't be a CT ?..and we want to trade with the trend !...wouldn't be safer to see first some bearish trend on higher TF, in order to trade D RETs ?
This is avery common mistake made by so many traders and we have to learn to avoid these attempting situation !
Thanks for your contribution and any question you have, please feel free to ask !
I now know i should hammer down the trend in higher TF (Month and Week).
I would like to ask several more questions, still use the AUDUSD as an example,
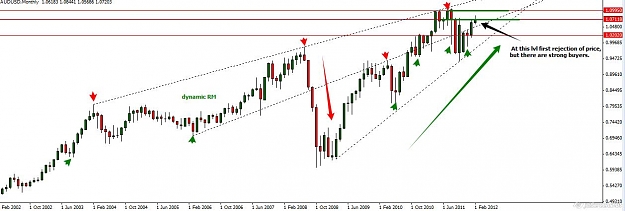
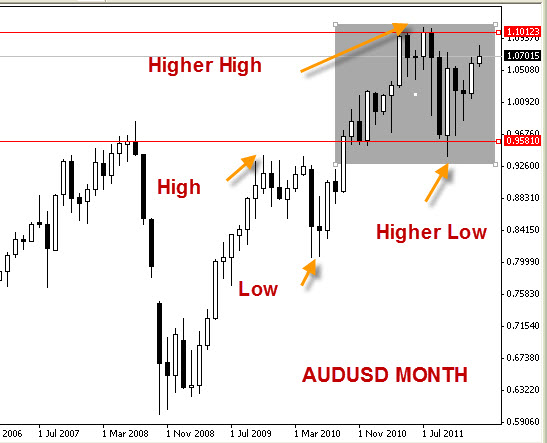
1) How to determine the trend is bullish in the month chat? In my chart, I tag the higher-high/high, higer-low/low, is this a correct way?
Since there is a higher-high, higher-low on the month chart, so it is a bullish in month chart, right?
2) As the gray box covered, can i assume this area as a range market? The critical line would be the close of the July 2011, price 1.0125, and the close of the Nov, 2010, price 0.9595, are these two lines labeled correct?
3)
As the post in the first page, there would be two methods, here the method a would be considered:
" a-Identify if the price is trendy market(up/down) on monthly and weekly charts, wait for a retracement with price action confirmation and entry on daily chart (buy at resistance and sell at support level)."
Here the price is trendy up on monthly line, waiting for the resistance line is broke up, i.e. the line 1.0125, and wait for a retracement with price action confirmation and entry on the daily chart nearby the 1.0125
Is this correct?
Thanks in advance!
Best Regards
Hi Dariusz , thanks for your comments, i just use the audusd month as an example to learn from you guys. Sorry for not write clear. Thanks!
Attached Image
Outcome is not important at all, but correct technique is what only matters
[quote=szpowerx;5397758]Thanks Fxgroup and Dariusz,
Hi szpowerx,
Tks for joining , Fxgroup putted lots of explanation in previous post, please look for that.
You right Trend ident. = hl+hh up, lh+ll dwn it is simple starting with M+W.
And behind each candle are buyers+sellers = PRICE in every graphical form.
Please if You put your chart try to catch M, W and which pair You want to present, which was naot visable on yours charts.
I now know i should hammer down the trend in higher TF (Month and Week).
I would like to ask several more questions, still use the AUDUSD as an example,
1) How to determine the trend is bullish in the month chat? In my chart, I tag the higher-high/high, higer-low/low, is this a correct way?
Since there is a higher-high, higher-low on the month chart, so it is a bullish in month chart, right?
2) As the gray box covered, can i assume this area as a range market? The critical line would be the close of the July 2011,...
Ignored
In a RM you don't really look at swings as hard as you do in a trend.
You will indeed prefer going with the previous trend (i.e. it was bullish, so look for signals on bullish RM swings) but you have to read the market most of all. Ie if you see that long shadow candles start to appear, it means the RM is slowly being overtaken by sellers.
Also, you want to seek for buying opportunities at the base of the RM (since there was a bullish trend) not in the middle or close to the top.
Or - safer - you might want to wait for RM to break upwards, then retrace on daily down to RM former resistance (now acting as support) and seek for price action retracing on such former resistance, confirming the break out.
1st i went short when the bear engulfing candle shown after hitting the RL, so in profit (1st day).
2nd day the bullish engulfing candle popped up, so in loss, and i exited manually afraid of uptrend resuming.
3rd day a bear candle (no trade).
4th day a bear PB (no trade).
5th day i took a short in view of the down momentum from RL, 1st day bearish engulfing & PB, so in profit, but a long wick pushing up after hitting the SL, the trade was still on.
6th & 7 days days in profit.
8th day a bull candle with a long upper wick, so the trade was still on.
9th day a pb shown with a long lower wick hitting on SL the 2nd time, decided ti exit manually.
10th day (last friday) no trade due thinking this could be a range market.
Pls. offer your comment on my trade analysis.
What is your plan for this week on gold?
Thanks for your time and indeed a good thread.
Keep it up.