James, could you comment on my take on this chart and your notes.
You expect a possible bounce off of the pivot line. You wait for the 2 or possibly more inside bars. The inside bars tell you a good break is about to happen. Because you were already looking for a bounce off of the pivot line, you take the trade long now because the inside bars add a little more confirmation to the trade. Is this your thinking on this trade?
Hey Jim how are ya? Thanks a million for all the knowledge you've shared with us. I'm very new to Forex (trading live for just over a week) and I've learnt a ton from this thread alone. You seem like a nice person - I like that. To me that says you've gained a level of awareness whereas the realization 'you only feel as good as you treat others' has materialised. And that means you'd make a good teacher. I'm very interested in joining your crew - I really need an older brother at this fragile point in my trading career.
Anyways more specific to the recent posts here: where do you think the CAD is heading? From what I can gather it's about to run into the descending trend line on the daily chart. Will it consolidate until a breakout leading the way back down? Nice work on that trade btw! Wish I had caught that...anyways thanks in advance for any help you can offer,
|
Commercial Member
|
Joined Feb 2005
|2,875 Posts
Quoting scpeter
Disliked
James, could you comment on my take on this chart and your notes.
You expect a possible bounce off of the pivot line. You wait for the 2 or possibly more inside bars. The inside bars tell you a good break is about to happen. Because you were already looking for a bounce off of the pivot line, you take the trade long now because the inside bars add a little more confirmation to the trade. Is this your thinking on this trade?
Ignored
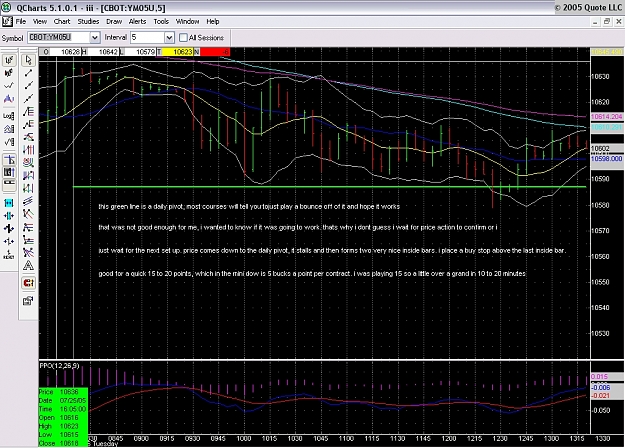
first of all inside bars are very commonly known and used by many traders. what blew my mind when i first joined this forum was i had forgotten what it was like to be new and not have a clue as to what an inside bar or any other bar meant. pivot levels are where a ton of orders are placed. i wont explain pivot levels just do a quick google search and you will have a complete education in about 15 minutes. inside bars show a tug of war developing between buyers and sellers. the more in a row you get the tighter it gets and when it breaks out it tends to move hard and fast. what everyone shoild do is go look for these on any time frame you want. particularly look for the sideways pyramid shape when you get two or more, they are easy to spot. when price moves down to a pivot level a ton of buy orders are triggered which tends to send it up. BUT NOT ALWAYS. i dont like to hope when i trade i like to know as sure as i can that what i want to happen is going to happen. thats why i try to stack things in my favor. for example the confluence i keep talking about. it could be 2 fib ret close together. it could be a pivot and fib close together. it could be any one of these combined with divergence. then you take it one step further and look for price action to confirm at these levels. its really not that hard. go to your charts plot your fibs and pivots on tomorrows blank page. then sit back and wait for price action to interact with these levels and make a smart trade not a guess. it will work on any time frame you choose. jim
|
Commercial Member
|
Joined Feb 2005
|2,875 Posts
Quoting 137
Disliked
Hey Jim how are ya? Thanks a million for all the knowledge you've shared with us. I'm very new to Forex (trading live for just over a week) and I've learnt a ton from this thread alone. You seem like a nice person - I like that. To me that says you've gained a level of awareness whereas the realization 'you only feel as good as you treat others' has materialised. And that means you'd make a good teacher. I'm very interested in joining your crew - I really need an older brother at this fragile point in my trading career.
Anyways more specific to the recent posts here: where do you think the CAD is heading? From what I can gather it's about to run into the descending trend line on the daily chart. Will it consolidate until a breakout leading the way back down? Nice work on that trade btw! Wish I had caught that...anyways thanks in advance for any help you can offer,
137
Ignored
yes a very nice downtrend with a ton of fib confluence AT SEVERAL LEVELS. but as i have said that means nothing to me in and of itself. if i see a bearish price action at one of these levels then i will consider a trade. at that point i can tell you with good probability where its headed but not until. thats what gets me about these courses, which i have bought by the way, that teach you to set your fib levels then set your order and laugh all the way to the bank. give me a break, do you know that there is one guy that teaches nothing but this and has over 3000 students at any given time paying him 100 bucks a month. 300,000 a month to teach you to trade off of fib levels with nothing else. what do you think keeps him in business. if you said new traders and a great marketing strategy you would be correct. nothing wrong with teaching new traders how to trade fib ret, but if thats all you use your in trouble.
pivot levels are where a ton of orders are placed. i wont explain pivot levels just do a quick google search and you will have a complete education in about 15 minutes. when price moves down to a pivot level a ton of buy orders are triggered which tends to send it up. BUT NOT ALWAYS. i dont like to hope when i trade i like to know as sure as i can that what i want to happen is going to happen. thats why i try to stack things in my favor. for example the confluence i keep talking about. it could be 2 fib ret close together. it could be a pivot and fib close together. it could be any one of these combined with divergence. then you take it one step further and look for price action to confirm at these levels. its really not that hard. go to your charts plot your fibs and pivots on tomorrows blank page. then sit back and wait for price action to interact with these levels and make a smart trade not a guess. it will work on any time frame you choose. jim
Ignored
Jim,
Thanks for sharing all this! I feel like you're tossing little gold nuggets at us and all we have to do is catch them!
Regarding the pivot line on the chart above, am I correct in assuming it is the central pivot point and not R3, R2, R1, S1, S2 or S3 ? Do you ever use any of the R or S levels, or do you just use the central pivot point only?
Also, I got the following from Mark McRae on how to calculate all seven pivot points from the previous day's high, low and close. Do these formulae line up with how you calculate them?
Resistance 3 = High + 2*(Pivot - Low)
Resistance 2 = Pivot + (R1 - S1)
Resistance 1 = 2 * Pivot - Low
Pivot Point = ( High + Close + Low )/3
Support 1 = 2 * Pivot - High
Support 2 = Pivot - (R1 - S1)
Support 3 = Low - 2*(High - Pivot)
Thanks Jim, and may God continue to bless you as you are blessing us!
first of all inside bars are very commonly known and used by many traders. what blew my mind when i first joined this forum was i had forgotten what it was like to be new and not have a clue as to what an inside bar or any other bar meant. pivot levels are where a ton of orders are placed. i wont explain pivot levels just do a quick google search and you will have a complete education in about 15 minutes. inside bars show a tug of war developing between buyers and sellers. the more in a row you get the tighter it gets and when it breaks out it tends to move hard and fast. what everyone shoild do is go look for these on any time frame you want. particularly look for the sideways pyramid shape when you get two or more, they are easy to spot. when price moves down to a pivot level a ton of buy orders are triggered which tends to send it up. BUT NOT ALWAYS. i dont like to hope when i trade i like to know as sure as i can that what i want to happen is going to happen. thats why i try to stack things in my favor. for example the confluence i keep talking about. it could be 2 fib ret close together. it could be a pivot and fib close together. it could be any one of these combined with divergence. then you take it one step further and look for price action to confirm at these levels. its really not that hard. go to your charts plot your fibs and pivots on tomorrows blank page. then sit back and wait for price action to interact with these levels and make a smart trade not a guess. it will work on any time frame you choose. jim
Hi Jim, I'm looking at the gbp chart and it may be at a triple high close. The last three days have all been very close highs and lows. Is there someway you would play this one? I don't see any other confluence to trade off. I did take the short at 60. Hope it works out.
Pipmon
|
Commercial Member
|
Joined Feb 2005
|2,875 Posts
Quoting pipmonster
Disliked
Hi Jim, I'm looking at the gbp chart and it may be at a triple high close. The last three days have all been very close highs and lows. Is there someway you would play this one? I don't see any other confluence to trade off. I did take the short at 60. Hope it works out.
Pipmon
Ignored
just saw your post pip, its late i will take a look tomorrow and post any thoughts. if you think you see one of the setups i have been talking about just papertrade them until you are SURE you see one. i still papertrade to this day on new things i learn or come up with. its a great way to try before you buy.
|
Commercial Member
|
Joined Feb 2005
|2,875 Posts
Quoting james16
Disliked
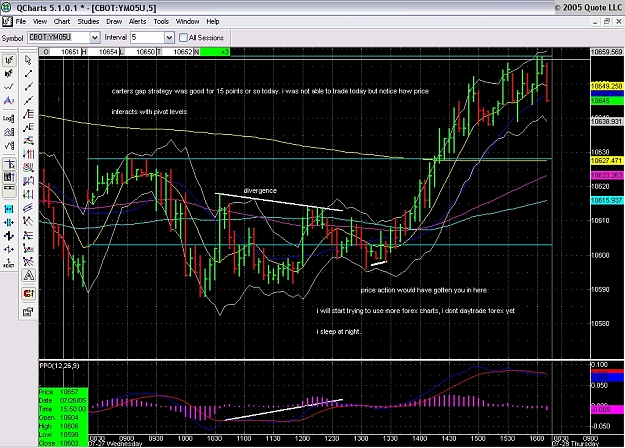
go take a look at the cad now. it broke up like a rocket, i have personally purchased courses for several thousand dollars that cant touch what i have provided here. in at the close of the tblhc at 1.2120, currently at 1.2298, up about 180 pips now, trailing my stop. jim
Ignored
holy breakout batman. do you smile more than you frown when you look at your charts. i actually keep a record of smiles vs frowns and then make notes of why. when i see a frown pattern developing i can then tie it to a reason and make neccesary adjustments. find something that works then fine tune, fine tune, fine tune. i never stop fine tuning. thats why papertrading is so important. try before you buy.
Re the CAD am interested learn how and when (what time bar) you entered and where your stop was located. I can clearly see your tblhc on the daily and you entered at 2120 so did you drop down to the 1hr and enter after the tblhc after the 38 fib bounce. The price bar indicators that appear on the daily sure seem reliable its just where to get in after they appear I struggle with ?
|
Commercial Member
|
Joined Feb 2005
|2,875 Posts
Quoting PipPincher
Disliked
Hi James,
Re the CAD am interested learn how and when (what time bar) you entered and where your stop was located. I can clearly see your tblhc on the daily and you entered at 2120 so did you drop down to the 1hr and enter after the tblhc after the 38 fib bounce. The price bar indicators that appear on the daily sure seem reliable its just where to get in after they appear I struggle with ?
Thanks in Advance for advice.
Ignored
good question and very simple answer. actually i think i put it somewhere. on the daily chart you have two choices for entry. at the close of the tblhc or on a fib ret of the last bar of the set up. taking the ret will lower your risk as you are entering closer to where you should have your stop which is just under the 2, or 3 in this case, bars. sometimes by doing this you will miss trades as it will not ret but just take off. if the bar is very long i always wait for a ret. if its short i dont. if you go back and look you will see that most of the time they ret. on daily trades i do not drop down to lower time frames for entry confirmation. enter on the close or enter on a ret of the one bar. most times i wait for at least a 38 ret of the last bar.
Cool thanks for that James... So for another example if we close near to where we are on the EUR and more so the gbp are they possible dblhc and tblhc entries ?
|
Commercial Member
|
Joined Feb 2005
|2,875 Posts
Quoting PipPincher
Disliked
Cool thanks for that James... So for another example if we close near to where we are on the EUR and more so the gbp are they possible dblhc and tblhc entries ?
Ignored
i will take a look. everyone keep in mind that i have not shared everything i do in this thread. price action in and of itself is a great tool and yes a lot of times they work in and of themselves. but what we really want is multiple signs of a probable winning trade. price action combined with fib ret, monthly and weekly pivot levels, divergence, confluence etc. i will be dissapointed if and when someone goes hey that dblhc did not work and they did not combine other tools to confirm. jim
|
Commercial Member
|
Joined Feb 2005
|2,875 Posts
3 gaps this week on the mini dow. all three worked like a charm. you can find it on cbot.com under education. its worth taking a look at. when the course is ready and merlin has me set up we are going to trade everything under the sun. forex, commodities, mini dow, currency futures, bonds. you name it. were gonna position trade, swing trade and day trade. its not hard to get set up to do this. our objective will not be to go 15 wins and 10 losses for a month. our goal will be to trade ultra smart and shoot for 80 to 90 percent win ratio. it can be done and its much more fun that way and it builds confidence.
I just signed up to this forum this weekend and I guess I couldn't have picked a better time. I am new to trading and forex, but I have saved your charts for reveiw at a later time when they will make more sense to me.
I just wanted to say thank you for sharing so much on this forum.
I would also like to add my two cents about the subject of you offering a course of some kind. As someone who is new to trading I would love to have a homestudy course with manuel and the dvd's to visually show what you are teaching. I am reading some books on trading to start with, but I know that I will need either a live course or DVD's to see and fully understand exactly what to look for.
I just happened to come across this thread a couple of days ago and I would like to thank you for all of the diligent work that you have put into posting your charts and familiarizing us with how your systems work. You have demonstrated that you are an excellent mentor for anyone interested in learning these trading techniques or fine tunning for some of us that have been trading for awhile.
I would like to add to Kevin’s comment and others on the thread that a DVD with a manual would be an very good way for of us to follow along what you are teaching.
Thanks again Jim, I am enjoying your charts to the max, please keep them coming.
|
Commercial Member
|
Joined Feb 2005
|2,875 Posts
Quoting leedee1
Disliked
.
I just happened to come across this thread a couple of days ago and I would like to thank you for all of the diligent work that you have put into posting your charts and familiarizing us with how your systems work. You have demonstrated that you are an excellent mentor for anyone interested in learning these trading techniques or fine tunning for some of us that have been trading for awhile.
I would like to add to Kevin’s comment and others on the thread that a DVD with a manual would be an very good way for of us to follow along what you are teaching.
Thanks again Jim, I am enjoying your charts to the max, please keep them coming.
Lee
Ignored
thanks to you and all the new people coming to the forum and noticing the chart thread. your encouragment means a lot to me and is the main reason i am proceeding with this project.