- Search Forex Factory
- 397 Results
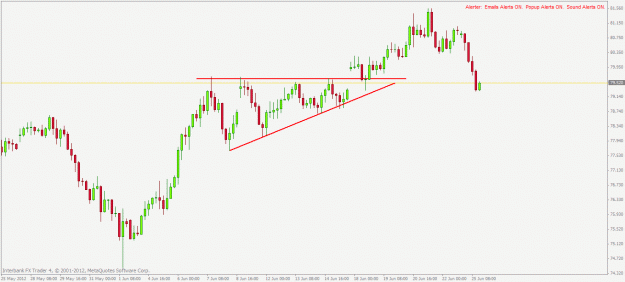
- Custos replied Jun 25, 2012
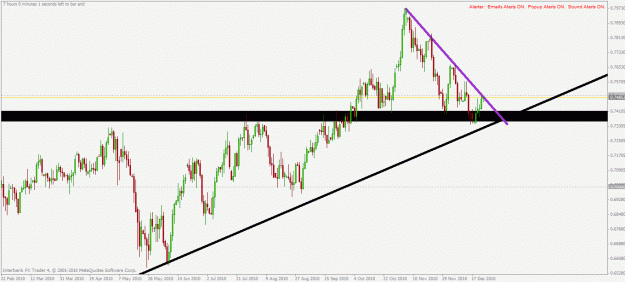
this is a triangle. You see the difference between the one I marked up and yours?
Trend Trading All Pairs
- Custos replied Jan 21, 2012
okay, I made now trendlines that would all be valid too, but would not allow me to participate in the subsequent winning trades that will get me out of my drawdown. I believe it's like with any technical tool on charts. In hindsight almost ...
It's A Heart-Mind Game... Are You Ready?
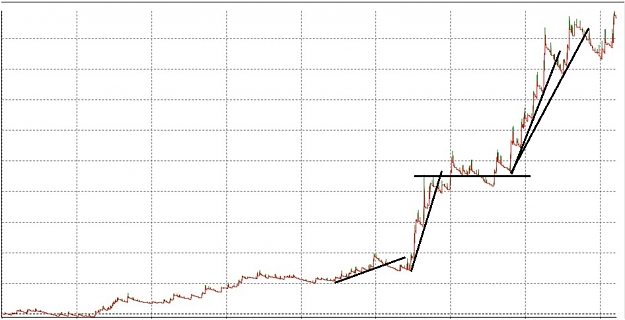
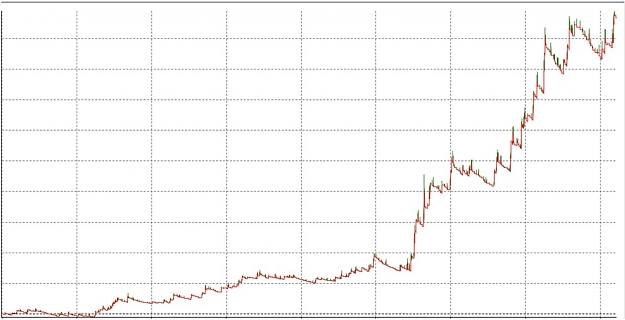
- Custos replied Jan 21, 2012
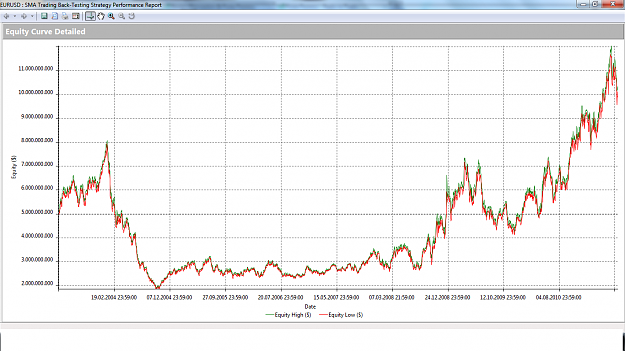
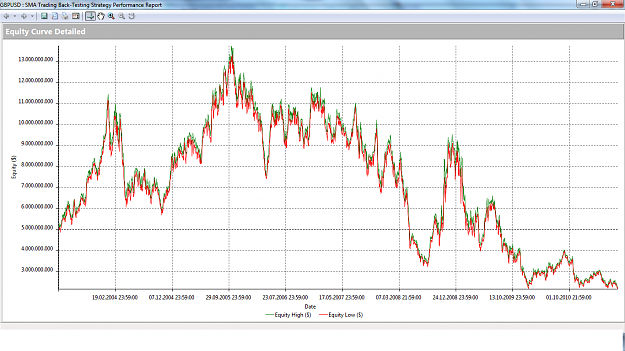
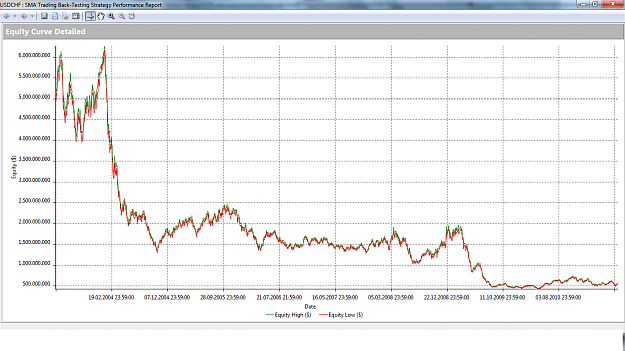
hm, okay. I want to offer a different opinion on the equity curve you posted. All in all it's a declining curve, for me it simply means that his system has no positive expectancy. Now in declining equity curves it is easy to draw some trendlines and ...
It's A Heart-Mind Game... Are You Ready?
- Custos replied Aug 14, 2011
First chart is gbp/jpy, second is eur/chf, both weekly time-frame. Now tell me which of the two was trending more? I don't know why I even have to show you that. it is so obvious, that the last two years eur/chf trended incredibly while gbp/jpy ...
Where is the EDGE in trading? The most important thing in trading!
- Custos replied Jun 7, 2011
So, since trading is so easy, I just coded your suggestion with position size 3% of the whole account per trade and as an attachment you find the equity curves. Seems like only a temporary edge at best. Looks good for the eur/usd from around 2008, ...
making things simple
- Custos replied Jan 20, 2011
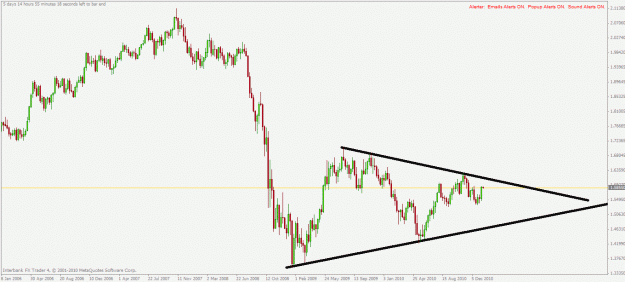
I would rather go for a short based on the daily. But if I look into the weekly we are anyways in a really big consolidation. There won't be any high probability trades in this pair.
Trend Trading All Pairs
- Custos replied Jan 17, 2011
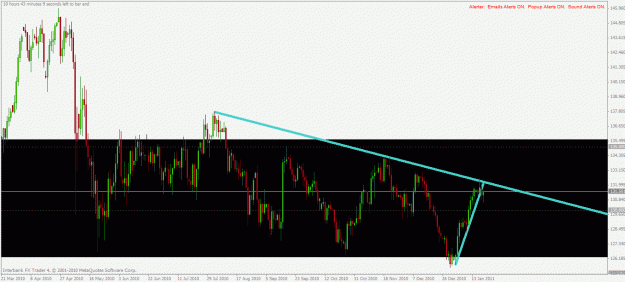
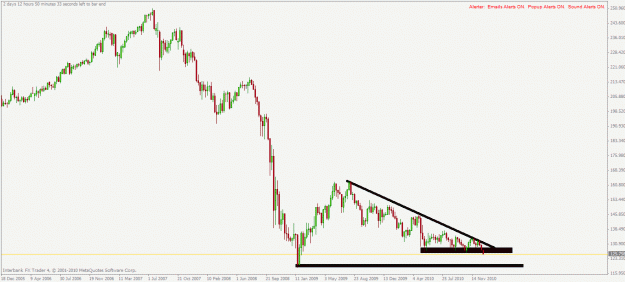
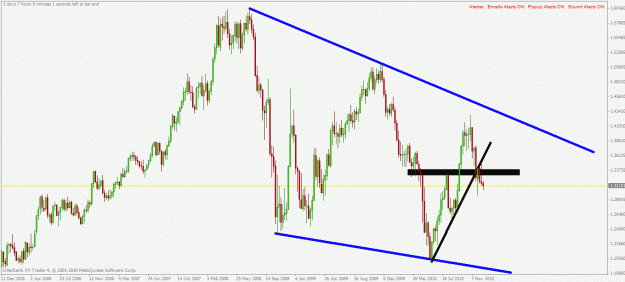
you have to watch the longer time-frames a bit more. gbp/usd is in a huge triangle on the weekly.
Trend Trading All Pairs
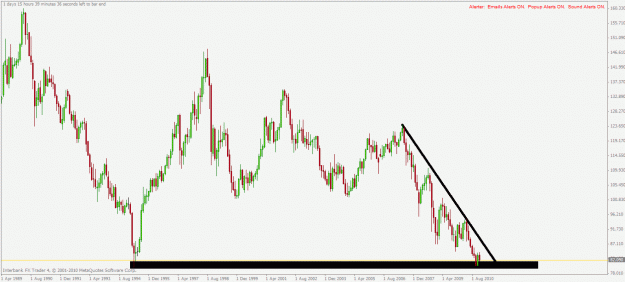
- Custos replied Jan 17, 2011
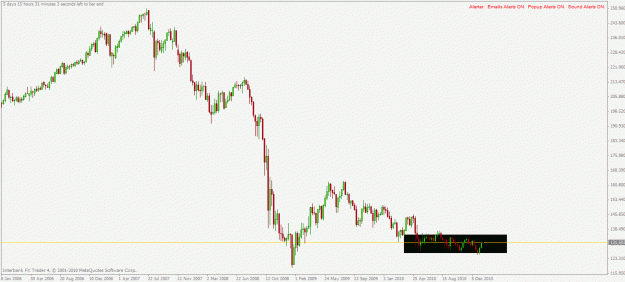
yep, have seen that, but the whole area is one big consolidation, so I won't do anything until it breaks that black marked consolidation.
Trend Trading All Pairs
- Custos replied Jan 12, 2011
gbp/aud looks pretty good! Am already in for a short!
Trend Trading All Pairs
- Custos replied Jan 10, 2011
Clusters of wicks — Hi, A new topic which I am currently looking at / researching is "clusters of wicks". Take out any chart, and look for wicks. Now if they appear for 3 or more candles and are only on one side, it seems that the market is ...
Trend Trading All Pairs
- Custos replied Jan 3, 2011
This is how you could have entered with hector's method. Attached is eur/gbp h1. I know, not according to the long-term trend, but stranger things have happened
Trend Trading All Pairs
- Custos replied Dec 30, 2010
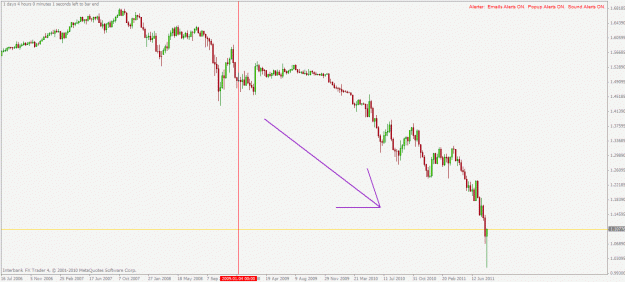
yep, and on the weekly it is now breaching support too. So, gbp/jpy will be high probability in the upcoming weeks for shorts.
Trend Trading All Pairs
- Custos replied Dec 29, 2010
hope you are seeing the support on monthly which usdjpy is banging against for the moment.
Trend Trading All Pairs
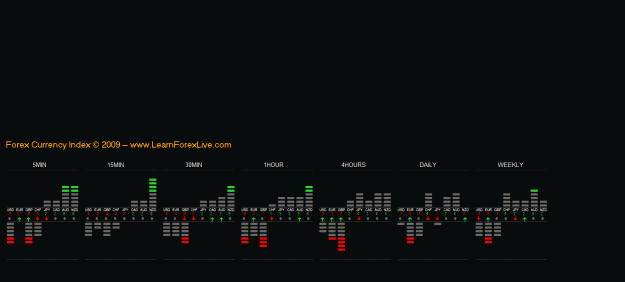
- Custos replied Dec 29, 2010
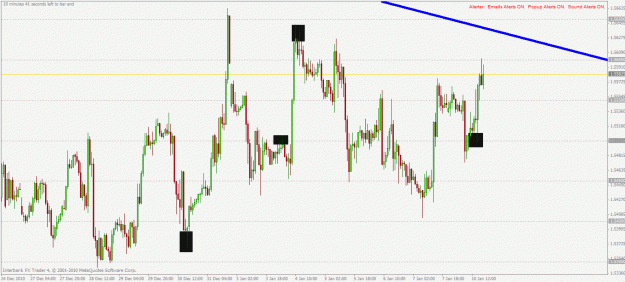
hm, from what I can see, the cad crosses are not correlated in the moment. You can see that on my attached picture.
Trend Trading All Pairs
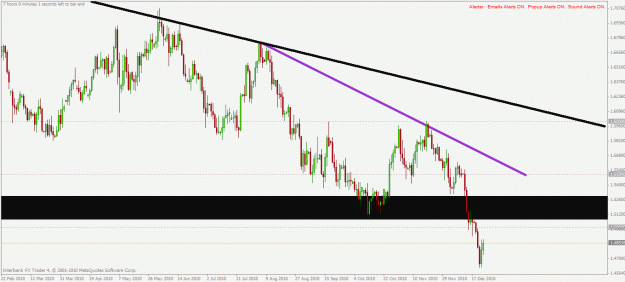
- Custos replied Dec 28, 2010
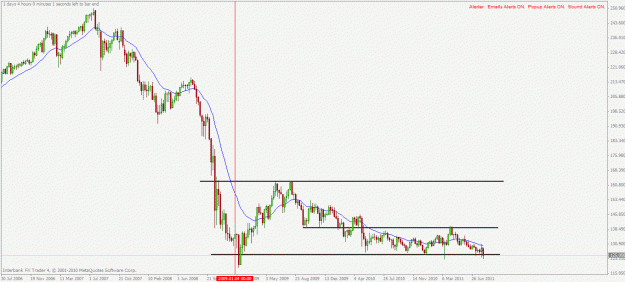
honestly, usdcad is my least favorite in the moment. If you look at the weekly. We are in a huge congestion area. Any trade within that congestion area will be low probability.
Trend Trading All Pairs
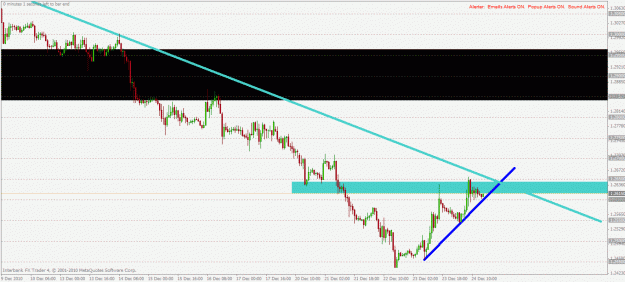
- Custos replied Dec 27, 2010
eurcad daily looks nice for a break to the downside.
Trend Trading All Pairs
- Custos replied Dec 25, 2010
A few other setups I would add: gbpaud h1 gbpchf daily eurchf h1 nzdusd daily
Trend Trading All Pairs
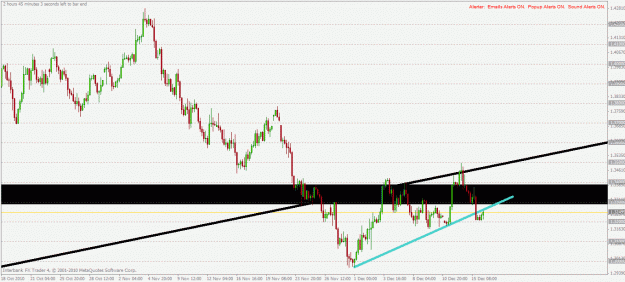
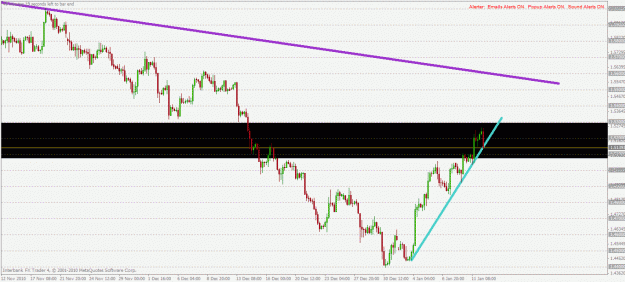
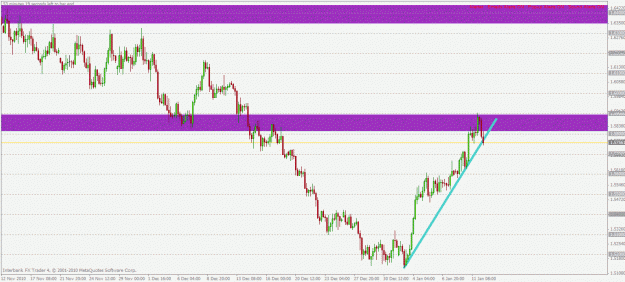
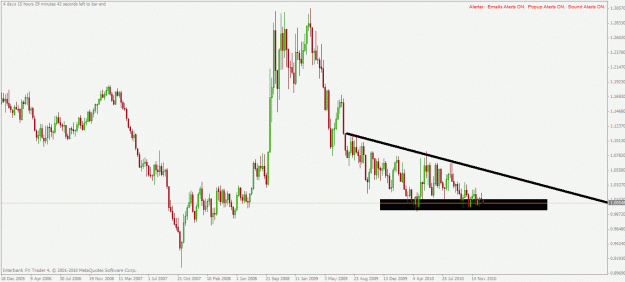
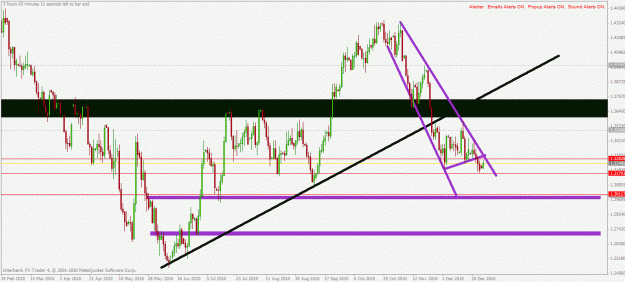
- Custos replied Dec 25, 2010
your eur/usd trendline doesn't make any sense to me. You just picked the most recent low. But how do you know that really is a low? Attached is how I have drawn mine. We are already below the trendline and the bias is already down. I am not even ...
Trend Trading All Pairs
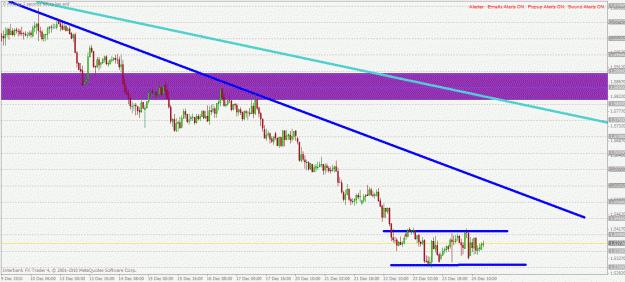
- Custos replied Dec 16, 2010
oh okay, that makes more sense now. I just want you to be aware that you are trading against a retracement trendline.
Trend Trading All Pairs